Download
1 / 60
610 likes | 1.33k Views
Perception. Presented by: Meghan Allen. Papers. Perceptual and Interpretative Properties of Motion for Information Visualization, Lyn Bartram. Internal vs. External Information in Visual Perception. Ronald A. Rensink.

E N D
Perception Presented by: Meghan Allen
Papers • Perceptual and Interpretative Properties of Motion for Information Visualization, Lyn Bartram. • Internal vs. External Information in Visual Perception. Ronald A. Rensink. • Level of detail: Varying rendering fidelity by exploiting human change blindness. Kirsten Cater, Alan Chalmers and Colin Dalton. • Face-based Luminance Matching for Perceptual Colormap Generation. Gordon Kindlmann, Erik Reinhard, and Sarah Creem. • Large datasets at a glance: Combining Textures and Colors in Scientific Visualization. Christopher G. Healey and James T. Enns.
Perceptual and Interpretative Properties of Motion for Information Visualization Lyn Bartram
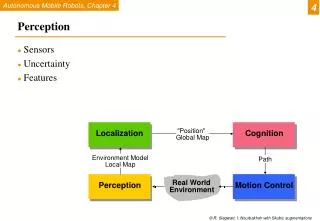
Motivation • Current interfaces exceed the human’s perceptual capacity to interpret them • Motion is a perceptually rich and efficient display mechanism, but little research has been done to determine how well it can display abstract data
Difficulties in visualizing information • Large amount of data requires a lot of screen real estate, as well as coordination between multiple windows • Dynamic nature of data requires users to notice changes • Some data appears in multiple parts of the visualization system, requiring users to assimilate the ‘big picture’ in their heads
Graphical representations • Shape, symbols, size, colour and position are ‘mentally economical’ • But, as the amount of data we want to visualize increases and as the size of the screen we are using increases, more attention needs to be paid to improving ‘information bandwidth’
Motion • Can motion be used to encode abstract data? • Motion is perceptually efficient and is becoming more technologically practical • Visual system is pre-attentively sensitive to motion across the entire visual field • Humans can pre-attentively track up to five objects in motion at the same time • By nature uses very little extra screen space • Can be ‘layered’ with existing representations to increase the dimensionality
Grouping • Humans perceive groups when they see multiple object moving in the same manner • This could be useful for denoting group membership for objects that are not spatially close • Could be useful for temporal as well as spatial groups
Future Directions • Conducting experiments into simple motion and types of patterns for grouping and association cues • How can motion convey relationships such as dependency and causality?
Critique • Interesting idea • Builds well on information that is known about the human perceptual system • I am not convinced that motion is a reasonable way of increasing displayed dimensionality.
Internal vs. External Information in Visual Perception Ronald A. Rensink
Human vision • We often feel that we must have a strong internal representation of all the objects we can see • Several experiments have argued against this • Attention is required to create a ‘stable object representation’
Change blindness • Subjects have difficulty noticing the changes that are made between the images • General phenomenon and can be induced many ways • Examples
Coherence theory • Low level proto-objects are continually formed, without attention. • Focused attention selects a small number of proto-objects, based on a feedback loop called a coherence field. • Proto-objects lose their coherence after focused attention is released.
Coherence theory Changes will only be noticed if the objects is being attended at the time
Virtual Representation • Only create a detailed representation of the object being attended • If these detailed representations can be created whenever needed, the scene representation will appear “real” to the higher levels, but with huge computational savings
Implications for displays • How can we create visual output that best match the type of information pickup described in coherence theory? • We can determine the order in which aspects of a scene are attended to, and use that information to select what to render • There are limits on what the user will perceive, which is important if the change itself was an important part of the visualization
Visual transitions • Humans may miss transitions, which could be an advantage or a disadvantage • User interfaces could attempt to take advantage of change blindness so that their transitions were invisible • Displays should minimize • the number of dynamic events occurring in the background • the number of saccades
Attentional coercion • Magicians have been using this for centuries • By controlling what people are paying attention to you can control what they see • A coercive display could ensure that important events are seen
Critique • Good descriptions of the different ways we visually perceive information • The figured aided my understanding of coherence theory and triadic architecture • I wanted to read about some real examples of coercive displays
Level of detail: Varying rendering fidelity by exploiting human change blindness. Kirsten Cater, Alan Chalmers and Colin Dalton
Motivation • Most virtual reality environments are too complex to be rendered in real time • Change blindness can be exploited to shorten rendering times without compromising perceived quality
Change blindness • ‘the inability of the human eye to detect what should be obvious changes’ • If attention is not focused on an object in a scene, changes to that object may go unnoticed • Occurs because our internal representation of the visual world is sparse and only contains objects of interest
Visual Attention • Spatial acuity is highest at the centre of the retina, the fovea • Visual angle covered by the fovea is approximately 2 degrees • Saccade: moving the next relevant object into the focus of the fovea
Background • O’Regan et al.’s flicker paradigm, and mudsplash paradigm • Marginal interest vs. Central interest • Peripheral Vision • Human eye only processes detailed information from a small part of the visual field
Experiment • 24 images, aspects of the images were labeled Central interest or Marginal interest • Principles of the flicker and mudsplash paradigms were used, but the image was rendered differently each time instead of using photographs
Experiment • Rendering quality was a factor • High resolution images took approximately 18 hours to render • Low resolution images took approximately 1 minute to render
Results • Subjects took significant amounts of time to notice the changes in the images • Modified central interest aspects were found faster than modified marginal interest aspects • Subjects were much slower to recognize rendering changes compared to location or presence changes
Conclusions • Computational savings could be dramatic • Inattentional blindness is the failure to see any unattended objects
Critique • ‘Change Blindness occurs in computer graphics images as it does in real life’ – seemed obvious to me • Didn’t give any specific guidelines on how to exploit Change Blindness in software applications
Face-based Luminance Matching for Perceptual Colormap Generation. Gordon Kindlmann, Erik Reinhard, and Sarah Creem
Luminance • Luminance is a very important aspect of visualization because it affects our perception of image structure and surface shape • 3 issues with using luminance in colormaps • Uncalibrated displays • Lighting conditions of the room are unknown • Yellow pigments can cause non-trivial differences
Luminance efficiency function • Describes the sensitivity of the eye to various wavelengths • Many of the techniques to measure the luminance efficiency function are based on matching • Goal is to create a task similar to the minimally distinct border method that is easier for users
Method • One face appears ‘positive’ while the other appears ‘negative’ • Black is replaced by gray and white is replaced by a colour
User study • Compared MDB to face based luminance matching • No significant difference by task, but face based luminance matching was more precise than MDB
Colormap generation • Need to create the hues in between the 6 that were matched by interpolation • Used data from the user study averaged over all participants and trials
Critique • Interesting idea • Succinctly explained the background information and related work • Well designed user study, with good hypotheses
Large datasets at a glance: Combining Textures and Colors in Scientific Visualization. Christopher G. Healey and James T. Enns
Objective • To create a method to display complex and large data sets that encode multiple dimensions on a single spatial point
Bottom up vs. top down • Bottom up: the limited set of features that psychologists have identified as being preattentive • Top down: attention is controlled by the task you are attempting to perform
Pexels • Multicolored perceptual texture elements (pexels) are used • Pexels have differing height, density, regularity and color • Goal: select texture and color properties that allow for fast visual exploration, while minimizing interactions between the visual features
Experiments • Can density, regularity and height be used to show structure? • How can we use the dataset’s attributes to control the values of each perceptual dimension? • How much visual interference occurs between the perceptual dimensions?
Results • Taller regions were identified very quickly • Shorter, denser, and sparser targets were more difficult to identify than taller targets, although some good results were still found • Background variation produced small, but statistically significant interaction effects
Results • Irregular targets were difficult to identify • Poor detection results for regularity were unexpected
Perceptual Colors • Designed experiments to select a set of n colors such that • Any color can be detected preattentively • Every color is equally easy to identify • Tested for the maximum number of colors that can be displayed simultaneously while satisfying the above requirements
Color • Color distance • Colors that are linearly separable from one another are easier to distinguish • Color category • Colors that are in different named categories (such as purple and blue) are easier to distinguish