Download

1 / 111
1.13k likes | 2.02k Views
Valuation of Sport Talent. Slides by Moon Song. The value of Sport Talent. General salaries Trend : Distribution of salaries is skewed toward superstars (Average >> Medium) Salaries have increased dramatically over time. Q : How can athletes be worth this much?

E N D
Valuation of Sport Talent Slides by Moon Song
The value of Sport Talent • General salaries Trend : • Distribution of salaries is skewed toward superstars (Average >> Medium) • Salaries have increased dramatically over time
Q : How can athletes be worth this much? Q : Why are players of different sports paid less than others? Endorsements : On average, endorsement earnings double the income of male superstars.
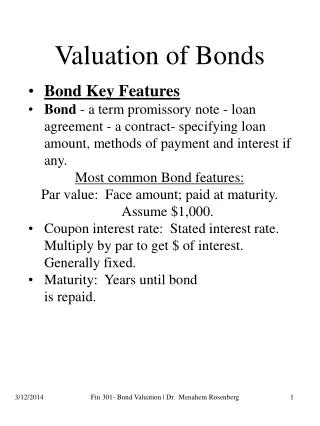
The Marginal Revenue Product (MRP) MRP : input’s contribution to the revenue earned by the team owner • Sports Talent is just an input to the sports production process. • Payment to inputs are determined by inputs’ MRP • The product of sports talent is winning (%).
W : the level of team winning % • MP(w) : marginal product ( = play’s contribution to winning%) • MR(w) : marginal revenue generated by the player’s contribution to winning
<EX> Scully study in the Business of Major League Baseball, 1989 Based on statistical results ; • One-point increase in winning percent raises about $46,276 revenue • a win = 6.2 winning % points • a win worth $286,912 If a solid slugger add 63 points (11 wins) • MRP is $3.2M If a strong pitcher add 20 net wins MRP is $5.7M
Q : Why do NBA players make more than NFL player? A1 : NBA player play more game than NFL players. A2 : NBA player has either higher marginal product than NFL player. or NBA fans are willing to pay more for added winning (demand by NBA fan is greater) or both
Real-World MRP Insight A. Payroll imbalance across teams Yankee’s payroll is 5.3 time larger than Twins and 2.5 times the average. • Top payroll teams are successful team from large revenue market B. Bust and Bargain • Players are paid their expected MRP • Busts and Bargains offset each other overtime, especially across an entire league
The relationship between Ticket Price and Salaries • Players can only earn more if • They become more productive ( MP(w) ↑) • Fans increase their willingness to pay for the game (MR(w) ↑) • Given MP(w) constant, MR(w) ↑ lead to increase in MRP, salary. • The reason players made more : some demand parameter has increased fan’s willingness to pay.
Salary vs. Ticket Price • Salaries move sometimes opposite, sometimes same direction as ticket prices Salaries do not drive ticket price up. • If ticket prices do not rise, where is the increase in fan’s willingness to pay that explain the increase in salaries? TV broadcast right fee increases in MR(w) portion of players’ MRP
Social values : Ballplayers vs. Teachers MRP : decreasing with w Demand function
Empirical Study (Scully) “Pay and Performance in MLB” • If labor market in MLB more perfectly competitive, player salaries would be equal to MRP • The “reserve clause” restricts player bargaining to one owner
Two factors • Effect of player performance on team winning : production function • The effect of team winning on team revenue : Revenue function Production function Output (winning) = f (inputs) inputs : performances Revenue function market Revenue = f (winning, market characteristics)
Performance • Hitter : the slugging average (SA) • Pitcher : strike out to – walk ratio (SW) • Quality of managerial and on the field decision making • CONT = 1 if team is within five games of the top squad in their respective division • OUT = 1 if a team is twenty or more games out of first place
Revenue = Home attention x Average ticket price + Revenue from broadcasting rights SMSA : population size of standard Metropolitan statistical area MARGA : Intensity of fan interest Percent win vs. attendance NL dummy STD = 1 if stadium was built in 1970 or later
One point PCTWIN increase revenue by $10,330 • One point in TSA or TSW increase PCTWIN by 0.92 and 0.90, respectively. MRP hitter = 0.92 x $10,330 = $9,504 per point TSA MRP pitcher = 0.90 x $10,330 = $9,297 per 1/100 point TSW
Omitted factor inputs : • Managerial quality • Player drafting and trading abilities • Stadium investment • Quality of minor league
Individual player MRP • Assumption : individual performance carrier with it no externalies Team performance is simply the linear combination of individual performance (EX) regular 10 pitcher, 15 non-pitcher 8 starter & relief, 12 regular non-pitcher • Average pitcher with SW of 2 0.125 * 2 = 0.25 points • Average hitter with SA of 340 0.083333 * 340 = 28.3 points
Average Marginal Revenue Product • Average pitcher 0.25 * 100 * 9,297 = $232,425 • Average hitter 28.3 * 9,504 = $268,963 • Need to adjust Gross MRP by deducting • Team costs : non-player salaries • Game costs : transportation, equipment, stadium rental • General administration costs • Sales costs Net MRP
(EX) Miguel Tejada • Number of at bats in 2002 ; 662 • Total number of team at bat (OAK) ; 5,558 • Percentage of total ; 662/5558 = 0.11911 • Total slugging average ; 0.508 • % of total ; 0.508 * 0.11911 = 0.0605 His contribution to PCTWIN ; 1.48166 * 0.0605 = 0.089661
Total game during regular season (2002) : 162 162 x 0.089661 = 14.5 (Tejada’s play was valued 14.5 wins to the A’s in 2002) 229,641 x 0.089661 x 1000 = $20,592,107 (actual salary : $3,625 mil)
Model’s weeknees ; • Defensive contribution • MVP • Leadership • at-bats vs. plate appearance Bonds MRP (403 at bats) = $19,935K Bonds MRP (601 plate-appearance) = $29,730K <198 walks>
Valuation of Sport Franchise Slides by Moon Song
Valuation of Sports Franchise • Forbes Estimates Jan.2005 Revenue(2003)
Revenue • Components : • Gate receipts • Local & National broadcasting rights • Licensing income • Other stadium-related revenue luxury boxer, concessions stadium naming rights * Revenue Sharing NFL : 60:40 MLB : 80:20 (AL) or 90:10 (NL) NBA/NHL : hometeam keeps all of the gate receipt
National broadcast revenues shared evenly among teams (NFL / MLB / NBA / NHL) • Franchises typically demand a 30~70% premium to the figure devised by Forbes. Why? • Role of Intangible assets is important in sport franchise value Player contracts, TV rights, stadium lease, advertising agreements, concession agreements, luxing suit agreements, season ticket contracts, draft rights, & good will • Ego premium
(EX) In 1998, Dodgers sold for $311mil, $80 mil more than Forbes’ estimated market value of $236 mil. Other relevant factors that escape Forbes’ analysis?
A Sport Franchise should technically be worth the present value of its expected future cash flow. • Sale Price = f ( revenue, attendance, team performance, debt/value, etc) (Problem) Most sports franchises are privately held. No obligation to report historical data or any present economic status.
(Case Ⅰ) In 2003, Boston Celtics sold for $360M. Forbes : 2002 value ≈ $275M (31% premium) Standard NBA multiple : 2.5 ~ 3 Celtics care 3.8 times What other factors? • Play off • Stadium revenues • Favorable debt agreement • Ego factor
(Case Ⅱ) In 2004, New Jersey Nets sold for $300M Forbes : 2003 value $217M What other factors? Move from Continental Arena to a new state of art complex at the center of a 2.5 billion office, residential & shopping complex. increase revenue due to easier access
(Case Ⅲ) Washington Redskins : sold at $800M in 1999. 1997 : FW $200M (grow at 32% / year) 1999 : FW $350M (estimated) Why factors drive transaction price up? • Auction • 2 year old stadium (80,116) • Any other intangible reason? • Cash flow of team : $55mil / year before tax and debt • Daniel Snyder’s Dream?
<Empirical Results Ⅰ> Forbes value = f (debt/Revenue, TRPS, Gate Receipts, Payroll) TRPS : team relative productivity score
Value vs. Revenue Value = f (Revenue)
<Empirical Results Ⅱ> Revenue = f (win, age, attendance, TVs, stadium, ticket price, payroll, another team)
Intangible Assets Assets that derive their value from the rights and privileges granted to their owner, long- term in nature, and lack physical substance • Purchased Intangibles; cost of purchase • Internally-created Intangibles; Legal Fees, Registration Fees
Marketing-related; Trademarks, Trade Names, & Internet Domain Names • Customer-related; Customer Lists and Relationship • Artistic-related; Copyright etc.
Contact-related; Franchise and Licensing Agreement, Construction Permit, Broadcast Rights, and Service or Supply Contracts. • Technology-related; Patent • Goodwill • Purchased ; the excess of purchase price over fair market value of identifiable net asset • Internally created; 0
Amortization of Intangible Assets Allocation of the cost of intangible asset in a systematic way over periods expected to Benefit from the use of the intangible assets • Limited-life Intangibles • Methods • Units of Activity Method • Straight Line Method
Legal Life • Copyrights ; 70 years beyond the death of the creator • Patent ; 20 years • Trademark ; indefinite number of renewal for a periods of 10 years each and is considered to have an indefinite life • Indefinite-Life Intangibles • Goodwill, Trademarks not to be amortized
Common types of professional sports team intangible assets • Play contracts • Local cable TV, broadcast TV, and broadcast radio contracts • Stadium lease • Advertising and/or sponsorship agreements • Concession agreements • Luxury suite agreements • Season ticket-holder relationship • Coach management employment contract • Draft rights • National franchise agreement • Goodwill and going-concern value
Sport Franchise Intangible Asset Valuation Procedures • Cost Approach Methods • Sales Comparison Approach • Income Approach Methods
Cost Approach Method • Substitution and utility • Replacement cost and reproduction cost • Cost should be adjusted for obsolescence to get value • Physical ; player contract • Functional ; • technological
Sales Comparison Approach • Efficient market and rational behavior • When sufficient transaction data exist, it method may be used to value stadium lease, concession agreements, and so on
Income Approach • Anticipation and rational expectation • Present value of a future economic income stream • Accounting income vs. economic income