Download
1 / 2
20 likes | 38 Views
Overall, we provide data in Excel from financial reports of companies traded in US. Investors and analysts use our data to do Financial modelling in Excel and decide what companies are good to invest in and which ones are not good.All companies send their reports to SEC in XBRL format (it's like XML/HTML) so it's relatively easy to extract that information.We retrieve that data from SEC, aggregate in our databases and then give access to the data from Excel. Our users download our Addin for Excel and get access to our data using paid subscription It is our new version of iXBRLAnalyst for Excel Online that can be used on any device and any browser.

E N D
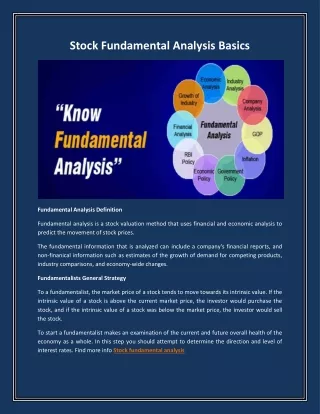
Stock Fundamental Analysis Basics Fundamental Analysis Definition Fundamental analysis is a stock valuation method that uses financial and economic analysis to predict the movement of stock prices. The fundamental information that is analyzed can include a company's financial reports, and non-finanical information such as estimates of the growth of demand for competing products, industry comparisons, and economy-wide changes. Fundamentalists General Strategy To a fundamentalist, the market price of a stock tends to move towards its intrinsic value. If the intrinsic value of a stock is above the current market price, the investor would purchase the stock, and if the intrinsic value of a stock was below the market price, the investor would sell the stock. To start a fundamentalist makes an examination of the current and future overall health of the economy as a whole. In this step you should attempt to determine the direction and level of interest rates. Find more info Stock fundamental analysis
After you analyzed the overall economy then analyze firms individually. You should analyze factors that give the firm a competitive advantage in its sector such as management experience, history of performance, growth potential, low cost producer, and etc. Fundamental Analysis Expressions For beginning I describe some stock fundamental analysis expressions that are more important: #1- EPS: (Earnings Per Share) The portion of a company's profit allocated to each outstanding share of common stock. The amount is computed by dividing net earnings by the number of outstanding shares of common stock. For example, a corporation that earned $10 million last year and has 10 million shares outstanding would report earnings per share of $1. #2- P/E Ratio: (Price/ EPS) Also called its "earnings multiple", Price of a stock divided by its earnings per share. The P/E ratio may either use the reported earnings from the latest year or employ an analyst's forecast of next year's earnings. P/E gives investors an idea of how much they are paying for a company's earning power. An important notice here is that the P/E ratio is ultimately not an objective measure; a high P/E ratio might show an overvalued stock, or it might reflect a company with high potential for growth. #3- Dividend Dividend is an amount of the profits that a company pays to people who own shares in the company. When a company earns a profit, some of this money is typically reinvested in the business and called retained earnings, and some of it can be paid to its shareholders as a dividend.