Download
1 / 5
60 likes | 120 Views
A simple, sensitive, precise and specific reverse phase high performance liquid chromatographic method was<br>developed and validated for the determination of Asenapine in bulk and tablet dosage forms. It was found that the<br>excipient in the tablet dosage forms does not interfere in the quantification of active drug by proposed method. The<br>HPLC separation was carried out by reverse phase chromatography on Shimadzu HPLC, 10-At detector with<br>hypersil ODS C18 Column 250 X 4.6 mm (particle size of 5µ) and constant flow pump. Rheodyne injector with 20µl<br>loop with a mobile phase composed pure methanol at flow rate 1.0 ml/min. The detection was monitored at 270nm.<br>The calibration curve for Tamsulosin was linear from 2-10mg/ml. The interday and intraday precision was found to<br>be within limits. The proposed method has adequate sensitivity, reproducibility and specificity for the determination<br>of Asenapine in bulk and its tablet dosage forms. LOD and LOQ for Asenapine were found to be 0.4329 and<br>0.1311.Accuracy (recoveries: 98.07-101.28%) and reproducibility were found to satisfactory.

E N D
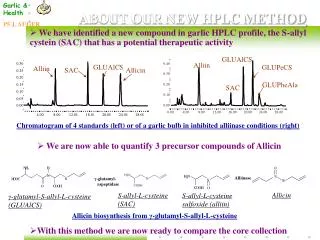
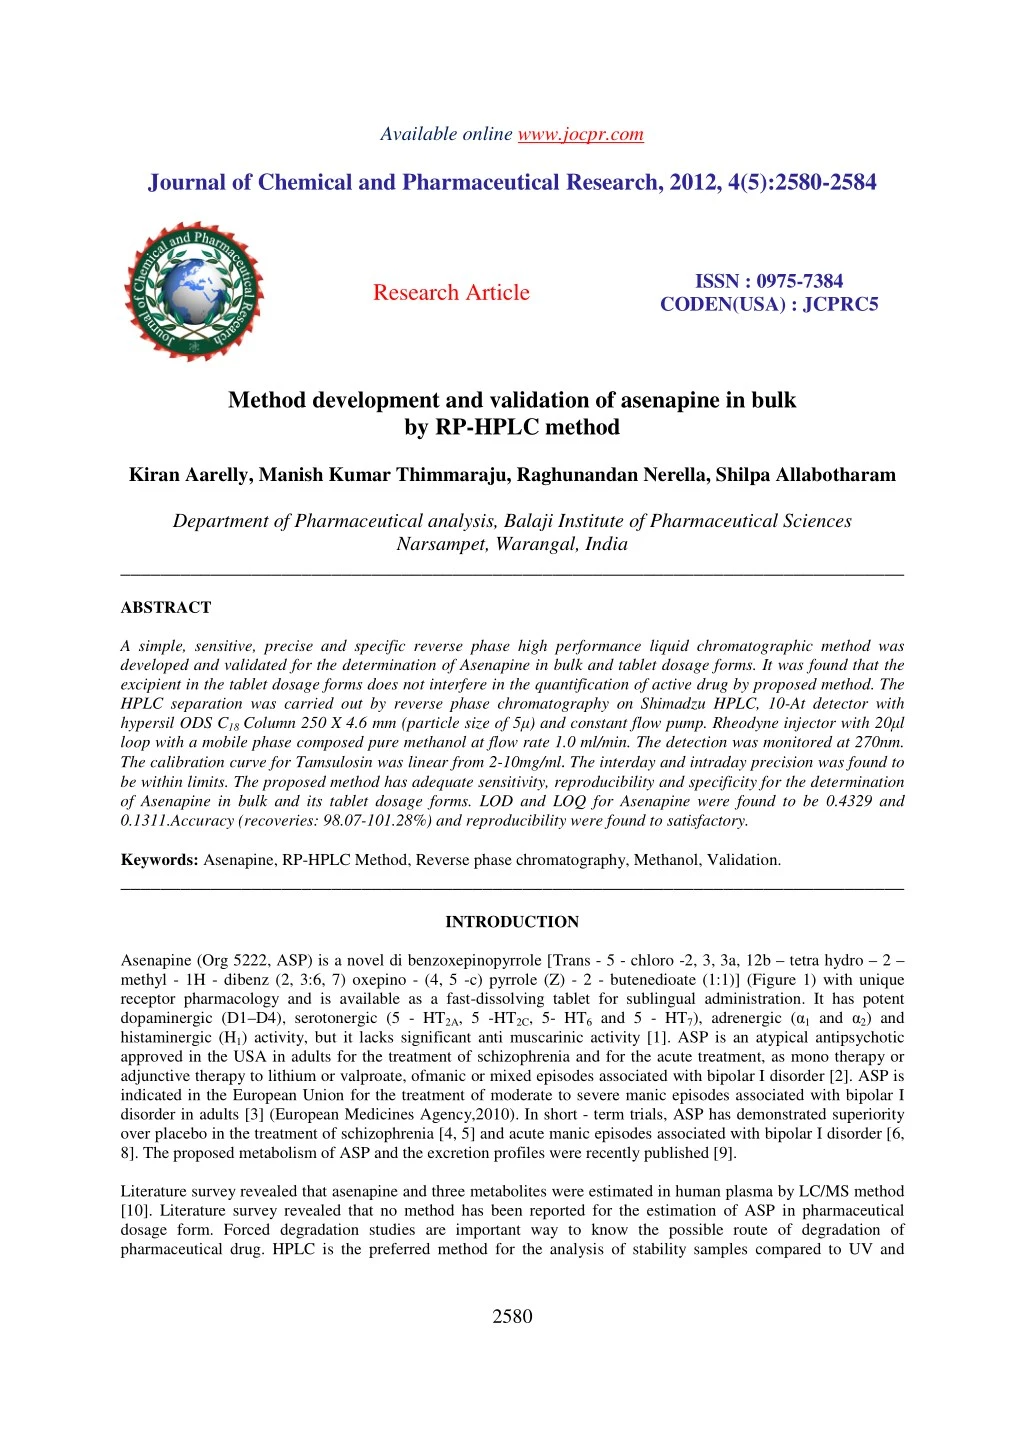
Available online www.jocpr.com Journal of Chemical and Pharmaceutical Research, 2012, 4(5):2580-2584 ISSN : 0975-7384 CODEN(USA) : JCPRC5 Research Article Method development and validation of asenapine in bulk by RP-HPLC method Kiran Aarelly, Manish Kumar Thimmaraju, Raghunandan Nerella, Shilpa Allabotharam Department of Pharmaceutical analysis, Balaji Institute of Pharmaceutical Sciences Narsampet, Warangal, India ______________________________________________________________________________ ABSTRACT A simple, sensitive, precise and specific reverse phase high performance liquid chromatographic method was developed and validated for the determination of Asenapine in bulk and tablet dosage forms. It was found that the excipient in the tablet dosage forms does not interfere in the quantification of active drug by proposed method. The HPLC separation was carried out by reverse phase chromatography onShimadzu HPLC, 10-At detector with hypersil ODS C18 Column 250 X 4.6 mm (particle size of 5µ) and constant flow pump. Rheodyne injector with 20µl loop with a mobile phase composed pure methanol at flow rate 1.0 ml/min. The detection was monitored at 270nm. The calibration curve for Tamsulosin was linear from 2-10mg/ml. The interday and intraday precision was found to be within limits. The proposed method has adequate sensitivity, reproducibility and specificity for the determination of Asenapine in bulk and its tablet dosage forms. LOD and LOQ for Asenapine were found to be 0.4329 and 0.1311.Accuracy (recoveries: 98.07-101.28%) and reproducibility were found to satisfactory. Keywords: Asenapine, RP-HPLC Method, Reverse phase chromatography, Methanol, Validation. ______________________________________________________________________________ INTRODUCTION Asenapine (Org 5222, ASP) is a novel di benzoxepinopyrrole [Trans - 5 - chloro -2, 3, 3a, 12b – tetra hydro – 2 – methyl - 1H - dibenz (2, 3:6, 7) oxepino - (4, 5 -c) pyrrole (Z) - 2 - butenedioate (1:1)] (Figure 1) with unique receptor pharmacology and is available as a fast-dissolving tablet for sublingual administration. It has potent dopaminergic (D1–D4), serotonergic (5 - HT2A, 5 -HT2C, 5- HT6 and 5 - HT7), adrenergic (α1 and α2) and histaminergic (H1) activity, but it lacks significant anti muscarinic activity [1]. ASP is an atypical antipsychotic approved in the USA in adults for the treatment of schizophrenia and for the acute treatment, as mono therapy or adjunctive therapy to lithium or valproate, ofmanic or mixed episodes associated with bipolar I disorder [2]. ASP is indicated in the European Union for the treatment of moderate to severe manic episodes associated with bipolar I disorder in adults [3] (European Medicines Agency,2010). In short - term trials, ASP has demonstrated superiority over placebo in the treatment of schizophrenia [4, 5] and acute manic episodes associated with bipolar I disorder [6, 8]. The proposed metabolism of ASP and the excretion profiles were recently published [9]. Literature survey revealed that asenapine and three metabolites were estimated in human plasma by LC/MS method [10]. Literature survey revealed that no method has been reported for the estimation of ASP in pharmaceutical dosage form. Forced degradation studies are important way to know the possible route of degradation of pharmaceutical drug. HPLC is the preferred method for the analysis of stability samples compared to UV and 2580
Kiran Aarelly et al ______________________________________________________________________________ J. Chem. Pharm. Res., 2012, 4(5):2580-2584 HPTLC method. As per ICH guideline,stability indicating method should be applicable in stress conditions like acid base hydrolysis, oxidative stress study, dry heat degradation and photo degradation study. In present study attempt has been made for the development of stability indicating liquid chromatographic method for the quantification of ASE in pharmaceutical dosage form [11-15]. Chromatographic conditions Chromatographic separation was performed on Shimadzu HPLC, 10-At detector with Hypersil ODS C18 Column 250 X 4.6 mm (particle size of 5µ) and constant flow pump. Rheodyne injector with 20 µl loop. The mobile phase methanol was delivered at flow rate 1.0 ml/min. The mobile phase was filtered through a 0.45 µ membrane filter and sonicated for 15min. Analysis was performed at ambient temperature. Optimized chromatographic conditions are listed in Table -1. EXPERIMENTAL SECTION T.D.Water (Triple distilled water), Methanol HPLC grade Methanol, Asenapine. PREPARATION OF STANDARD DRUG: Stock solutions of the drug (pure) dissolving 10 mg of Asenapine in 100ml of Methanol (HPLC Grade, MERCK).Daily working standard solutions of Asenapine were prepared between the range of 2-10mg/ml with appropriate mobile phase. METHOD VALIDATION Once the HPLC method development was over, the method was validated in terms of parameters like, precision, accuracy, linearity and range, LOD, LOQ, recovery studies, system suitability parameters etc. For all the parameters percentage relative standard deviation values were calculated. The proposed HPLC method was validated as per ICH guidelines. Linearity and Range The linearity of measurement was evaluated by analysing different concentrations of the standard solutions of the Asenapine .The Beer lamberts concentration was found to be between 2-10µg/ml. Calibration curve was constructed by plotting average peak area against concentration and regression equation was computed. The results were shown in Fig: 2.The slope, intercept and correlation coefficient values were found to be 6.845, 0.2095 and 0.991 Precision Precision was evaluated by carrying out three independent sample preparation of a single lot of formulation. The sample solution was prepared in the same manner as described in the sample preparation. Percentage relative standard deviation (% RSD) was found to be less than 2% for within a day and day to day variations, which proves that method is precise. Results were shown in Table 2. Limit of Detection and Limit of Quantification The limit of Detection (LOD) and limit of Quantification (LOQ) of the developed method were determined by injecting progressively low concentrations of the standard solutions using the developed RP-HPLC method. The LOD is the smallest concentration of the analyte that gives a measurable response (signal to noise ratio of 3). The LOD for Asenapine found to be 0.4329 The LOQ is the smallest concentration of the analyte, which gives response that can be accurately quantified (signal to noise ratio of 10). The LOQ was 0.1311 It was concluded that the developed method is sensitive. Recovery Studies To determine the accuracy of proposed method recovery studies carried out by taking different amounts of bulk sample of Asenapine within the linearity range were taken and added to the pre-analysed formulation. From that percent recovery values were calculated. Results were given below in Table-3. System suitability parameters System suitability parameters can be defined as tests to ensure that the method can generate results of acceptable accuracy and precision. The requirements for system suitability are usually developed after method development and 2581
Kiran Aarelly et al ______________________________________________________________________________ J. Chem. Pharm. Res., 2012, 4(5):2580-2584 validation have been completed. The USP (2000) defines parameters that can be used to determine system suitability prior to analysis. The system suitability parameters like Theoretical plates, Asymmetric factor(As)), Tailing factor (T), LOD (mcg/ml), LOQ (mcg/ml) were calculated and compared with standard values to ascertain whether the proposed RP- HPLC method for the estimation of Asenapine in pharmaceutical formulations was validated or not. The results are recorded in Table-4. RESULTS AND DISCUSSION From the optical characteristics of the proposed method it was found that the drug obeys linearity range within the concentration of 2-10µg/ml. From the results shown precision it was found that the percent RSD is less than 2%, which indicates that the method has good reproducibility. From the results shown in accuracy it was fond that the percent recovery values of pure drug from the pre analyzed solutions of formulations were in between 98.07- 101.28%, which indicates that the method is accurate. The system suitability parameters are within the specified limits and which refers the commonly used excipients and additives present in the pharmaceutical formulations did not interfere in the proposed method. The proposed method was found to be simple, precise, accurate and rapid for determination of Asenapine from pure form. The mobile phase is simple to prepare and economical. Fig-1 Asenapine TABLE-1. OPTIMIZED CHROMATOGRAPHIC CONDITIONS Parameters Hypersil ODS C-18, 250 x 4.6 mm, Method Stationary phase (column) packed with 5 micron) Methanol 1.0 07 Ambient 20 270 4.081 Mobile Phase Flow rate (ml/min) Run time (minutes) Column temperature (°C) Volume of injection loop (l) Detection wavelength (nm) Drug RT (min) TABLE-2 INTRA – DAY AND INTER – DAY PRECISION OF ASENAPINE STANDARD Intra-day concentration measured µg/ml Mean (a) 2 13.283 6 38.342 10 67.296 TABLE -3 Accuracydata of the developed method SNo Concentration(mcg/ml) Mean peak area 1 2 13.199 2 4 25.475 3 6 38.012 4 8 53.875 5 10 67.156 S.D-Standard Deviation, %RSD-Relative Standard Deviation *Each value is average of five determinations standard deviation Inter-day concentration measured µg/ml Mean (b) 13.134 38.120 67.364 Theoretical concentration µg/ml Drug RSD % 1.31 0.88 0.89 RSD % 1.1 1.41 0.94 Asenapine S.D %RSD 1.75 1.22 0.53 0.63 0.53 %Recovery 98.07 101.28 99.62 100.72 99.39 0.231399 0.312617 0.20294 0.341425 0.356724 2582
Kiran Aarelly et al ______________________________________________________________________________ J. Chem. Pharm. Res., 2012, 4(5):2580-2584 Fig-2- Linearity of Asenapine [Concentration (mcg/ml) (X-axis) vs. Peak Area (Y-axis)] y = 6.8454x - 0.2095 R2 = 0.9991 80 70 60 50 peak area 40 30 20 10 0 0 2 4 6 8 10 12 conc(mcgml) Fig-3 chromatogram TABLE-4 S.No 1. 2. 3. 4. 5. Parameters Theoretical plates (N) Asymmetric factor(As) Tailing factor (T) LOD (g/ml) LOQ (g/ml) Obtained Values 2960 0.97 1.0 0.4329 0.1311 2583
Kiran Aarelly et al ______________________________________________________________________________ J. Chem. Pharm. Res., 2012, 4(5):2580-2584 CONCLUSION A convenient and rapid RP- HPLC method has been developed for estimation of Asenapine in tablet dosage form. The assay provides a linear response across a wide range of concentrations. Low intra-day and inter-day % RSD coupled with excellent recoveries. Hence, this method can be easily and conveniently adopted for routine analysis of Asenapine in pure form and its dosage forms and can also be used for dissolution or similar studies. Acknowledgement I am very much thank full to Professor and Principal Dr.N.Raghunandan,Balaji Sciences, Warangal, for his guidance, kind help and encouragement at every step during the progress of my work constant. I am also grateful to my scholars and my friends for their kind help from time to time at each and every step of this work. REFERENCES [1] Shahid M, Walker GB et al. Journal of Psychopharmacology. 2009,23,65–70 [2] Saphris®.Asenapine sublingual tablets. Full prescribing information. Schering Corporation, a subsidiary of Merck & Co. Inc. 2010. Whitehouse Station, NJ0. Available from: http://www.spfiles.com/pisaphrisv1. pdf. Accessed January 2011. [3] European Medicines Agency. Sycrest asenapine. 2010. Available from. http://www.ema.europa.eu/ema/index.jsp?curl=pages/medicines/human/medici nes/001177/human_med_001379.jsp&murl=menus/medicines/medicines.jsp& mid=WC0b01ac058001d124&jsenabled=true ,accessed 28 September 2010. [4] Potkin SG, Cohen M, Panagides J. Journal of Clinical Psychiatry. 2007,68,1492–1500. [5] Kane JM, Cohen M, Zhao J, Alphs L, Panagides J. Journal of Clinical Psychopharmacology. 2010,30,106–115. [6] McIntyre RS, Cohen M, Zhao J et al. Bipolar Disorder.2009a,11,673–686. [7] McIntyre RS, Cohen M, Zhao J et al. Bipolar Disorder. 2009b,11,815–826. [8] McIntyre RS, Cohen M, Zhao J et al. Journal of Affective Disorders. 2010,122, 27–38. [9] Van de Wetering-Krebbers SFM, Jacobs PL, Kemperman GJ et al, Drug Metabolism and Disposition. 2011, 39,580 – 590. [10] de Boera T, Meulmana E et al.Quantification of asenapine and three metabolites in human plasma using liquid chromatography–tandem mass spectrometry with automated solid phase extraction: application to a phase I clinical trial with asenapine in healthy male subjects. Biomedical Chromatography. 2011 (published ahead of print)DOI 10.1002/bmc.1640 [11] Topic Q1B Photo stability Testing of New Drug Substances and Products.International Conference on Harmonization (ICH), IFPMA, Geneva, 1996. [12] Topic Q2 (R1) Validation of Analytical Procedure; Test and Methodology.International Conference on Harmonization (ICH), Geneva, 2005. [13] Topic Q2A Validation of Analytical Procedures: Consensus Guidelines. International Conference on Harmonization (ICH), Geneva, 1994. [14] Topic Q2B Validation of Analytical Procedures: Methodology, Consensus Guidelines.International Conference on Harmonization (ICH), Geneva, 1996. [15] Topic Q1A (R2) Stability Testing of New Drug Substances and Products.International Conference on Harmonization (ICH), IFPMA, Geneva, 2003. Institute of Pharmaceutical 2584