Download
1 / 8
80 likes | 89 Views
The aim of the present work was to develop and validate a simple, efficient, economical RP-HPLC method for the<br>simultaneous estimation of Lisinopril (LIS) and Hydrochlorothiazide (HCTZ) in bulk, dosage forms and in<br>dissolution samples of LIS and HCTZ tablets. Chromatography was performed on Inertsil ODS 3 column (250 x<br>4.6mm, 5µm) with mobile phase containing 10mM Ammonium acetate: Acetonitrile (80:20% v/v) at a flow rate of<br>1mL/min and eluents were monitored at 220nm. The retention times of LIS and HCTZ were 3.7min and 7.6min<br>respectively and showed a good linearity in the concentration range of 2-10µg/mL for LIS and 5-25ug/mL for HCTZ<br>with a correlation coefficient of 0.998 and 0.996 respectively. The validation characteristics included specificity,<br>linearity, and limit of detection, limit of quantification, precision, robustness and stability. Validation parameters<br>fulfilled regulatory requirements in all cases. The percent recoveries were ranged in between 98-102, (RSD < 2).<br>The developed HPLC method was successfully used for the simultaneous analysis of LIS and HCTZ in bulk, dosage<br>forms and in dissolution samples of marketed LIS-HCTZ combination tablets. <br>

E N D
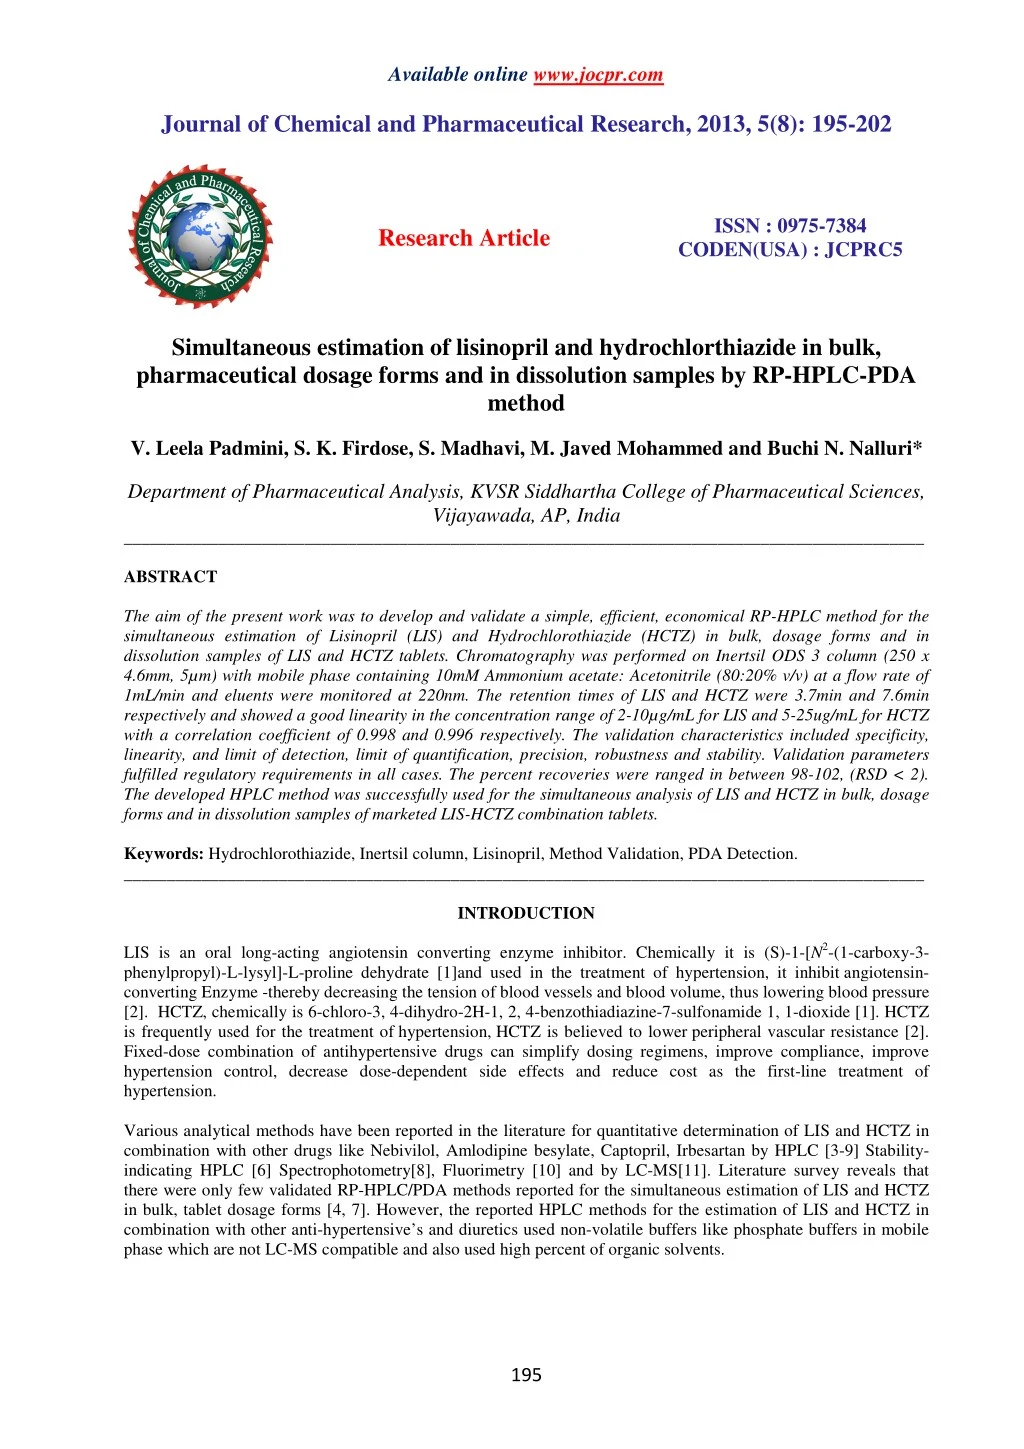
Available online www.jocpr.com Journal of Chemical and Pharmaceutical Research, 2013, 5(8): 195-202 ISSN : 0975-7384 CODEN(USA) : JCPRC5 Research Article Simultaneous estimation of lisinopril and hydrochlorthiazide in bulk, pharmaceutical dosage forms and in dissolution samples by RP-HPLC-PDA method V. Leela Padmini, S. K. Firdose, S. Madhavi, M. Javed Mohammed and Buchi N. Nalluri* Department of Pharmaceutical Analysis, KVSR Siddhartha College of Pharmaceutical Sciences, Vijayawada, AP, India _____________________________________________________________________________________________ ABSTRACT The aim of the present work was to develop and validate a simple, efficient, economical RP-HPLC method for the simultaneous estimation of Lisinopril (LIS) and Hydrochlorothiazide (HCTZ) in bulk, dosage forms and in dissolution samples of LIS and HCTZ tablets. Chromatography was performed on Inertsil ODS 3 column (250 x 4.6mm, 5µm) with mobile phase containing 10mM Ammonium acetate: Acetonitrile (80:20% v/v) at a flow rate of 1mL/min and eluents were monitored at 220nm. The retention times of LIS and HCTZ were 3.7min and 7.6min respectively and showed a good linearity in the concentration range of 2-10µg/mL for LIS and 5-25ug/mL for HCTZ with a correlation coefficient of 0.998 and 0.996 respectively. The validation characteristics included specificity, linearity, and limit of detection, limit of quantification, precision, robustness and stability. Validation parameters fulfilled regulatory requirements in all cases. The percent recoveries were ranged in between 98-102, (RSD < 2). The developed HPLC method was successfully used for the simultaneous analysis of LIS and HCTZ in bulk, dosage forms and in dissolution samples of marketed LIS-HCTZ combination tablets. Keywords: Hydrochlorothiazide, Inertsil column, Lisinopril, Method Validation, PDA Detection. _____________________________________________________________________________________________ INTRODUCTION LIS is an oral long-acting angiotensin converting enzyme inhibitor. Chemically it is (S)-1-[N2-(1-carboxy-3- phenylpropyl)-L-lysyl]-L-proline dehydrate [1]and used in the treatment of hypertension, it inhibit angiotensin- converting Enzyme -thereby decreasing the tension of blood vessels and blood volume, thus lowering blood pressure [2]. HCTZ, chemically is 6-chloro-3, 4-dihydro-2H-1, 2, 4-benzothiadiazine-7-sulfonamide 1, 1-dioxide [1]. HCTZ is frequently used for the treatment of hypertension, HCTZ is believed to lower peripheral vascular resistance [2]. Fixed-dose combination of antihypertensive drugs can simplify dosing regimens, improve compliance, improve hypertension control, decrease dose-dependent side effects and reduce cost as the first-line treatment of hypertension. Various analytical methods have been reported in the literature for quantitative determination of LIS and HCTZ in combination with other drugs like Nebivilol, Amlodipine besylate, Captopril, Irbesartan by HPLC [3-9] Stability- indicating HPLC [6] Spectrophotometry[8], Fluorimetry [10] and by LC-MS[11]. Literature survey reveals that there were only few validated RP-HPLC/PDA methods reported for the simultaneous estimation of LIS and HCTZ in bulk, tablet dosage forms [4, 7]. However, the reported HPLC methods for the estimation of LIS and HCTZ in combination with other anti-hypertensive’s and diuretics used non-volatile buffers like phosphate buffers in mobile phase which are not LC-MS compatible and also used high percent of organic solvents. 195
Buchi N. Nalluri et al ______________________________________________________________________________ J. Chem. Pharm. Res., 2013, 5(8): 195-202 Hence, the present investigation was aimed at developing a validated RP-HPLC-PDA method for the simultaneous analysis of LIS and HCTZ in bulk, dosage forms and in vitro dissolution samples of LIS-HCTZ tablets which is LC- MS compatible and economical. EXPERIMENTAL SECTION Chemicals LIS and HCTZ were gift samples from Hetero drugs Ltd, India. Ammonium acetate, water and methanol were purchased from E. Merck, Mumbai, India. All the solvents and reagents were of HPLC grade. LISTRIL PLUSTM (manufactured by Torrent Pharmaceuticals Limited, Sikkim) tablets containing LIS 5mg and HCTZ 12.5mg were commercially purchased. Equipment A Shimadzu Prominence HPLC system provided with DGU-20A3 degasser, LC-20AD binary pumps, SIL-20AHT auto sampler, and SPD-M20A PDA detector was used. Data acquisition was carried out using LC solutions software. The chromatographic analysis was performed on Inertsil ODS-3 RP column (250 × 4.6mm, 5µm). Chromatographic Conditions Mobile phase consisting of 10mM Ammonium acetate: Acetonitrile (80:20% v/v) was used in isocratic mode and the mobile phase was filtered through nylon disc filter of 0.45µm (Millipore) and sonicated for 3 min before use. The flow rate was 1 mL/min and the injection volume was 10µL. PDA detection was performed at 220nm and the separation was achieved at ambient temperature. Preparation of stock and standard solutions The stock solutions of LIS and HCTZ (mg/mL) were prepared by dissolving 10 mg of each drug separately in methanol in 10 ml volumetric flasks and volume was adjusted to the mark with the same. An appropriate volume of the stock solution was then further diluted with ammonium acetate to get the required concentrations of standard solutions at a concentration range of 2-10µg/mL of LIS and 5-25µg/mL of HCTZ. Validation of the HPLC method The proposed method was validated as per ICH guidelines. Linearity A linear relationship was evaluated across the range of the analytical procedure with a minimum of five concentrations. A series of standard dilutions of LIS and HCTZ were prepared over a concentration range of 2- 10µg/mL (2, 4, 6, 8, 10µg/mL) and 5-25µg/mL (5, 10, 15, 20, 25µg/mL) respectively from stock solution and injected in triplicate. Linearity is evaluated by a plot of peak areas as a function of analyte concentration, and the test results were evaluated by appropriate statistical methods where by slope, intercept, and regression (R2) correlation coefficients (R) were calculated and the data was given in Table-1. Precision Precision is the measure of closeness of the data values to each other for a number of measurements under the same analytical conditions. Repeatability was assessed by using a minimum of six determinations at 100% of the test concentration. The standard deviation and the relative standard deviation were reported for precision. Less than 2% RSD for peak areas indicates the precision of the developed method and the data was presented in Table-1. Specificity The specificity of the method was determined by comparing the chromatograms obtained from the drug substance with that obtained from the tablet solution. The overlay of diluent, placebo, standard and sample were presented in Figure-2. The retention times of drug substance and the drug product were observed. Absence of interference of excipients in the tablet indicates the specificity of the proposed method. Accuracy Accuracy was established across the specified range of the analytical procedure. To ascertain the accuracy of the proposed method recovery studies were performed by the standard addition method by spiking 80%, 100%, 120% of the known quantities of standard within the range of linearity to the synthetic solution of drug product (4µg/mL and 10ug/mL) and these solutions were analyzed by developed method in triplicate. The % recovery and the RSD were calculated at each level of addition and the data was given in Table-1. 196
Buchi N. Nalluri et al ______________________________________________________________________________ J. Chem. Pharm. Res., 2013, 5(8): 195-202 Limit of Detection (LOD) and Limit of Quantification (LOQ) LOD and LOQ were calculated based on calibration curves. They were expressed as LOD = (3.3 ×σ)/m; LOQ= (10.0×σ)/m (Where, σ is the standard deviation of the y-intercepts of the three regression lines and m is mean of the slopes of the three calibration curves). Robustness To determine the robustness of the method developed, the experimental conditions were deliberately altered and the chromatographic parameters viz., capacity factor, tailing factor, no. of theoretical plates and % assay were recorded. The flow rate of the mobile phase was 1mL/min. To study the effect of flow rate, the flow rate was changed by 20% and the effect of wavelength was studied by changing wavelength by ±1nm and the data was given in Table-2. System suitability System suitability was carried out by injecting a standard concentration at different injection volumes in the range of 10-50µL. The system suitability test parameters were noted and RSD was calculated. Assay Twenty tablets were weighed and finely powdered, the powder equivalent to 10mg was accurately weighed and transferred into a 10mL volumetric flask and dissolved in methanol and vortexed for 5min and volume was adjusted up to the mark with methanol. The above solution was centrifuged and then filtered using Nylon disposable syringe filter (13mm, 0.45µm). An aliquot of filtrate was diluted with Ammonium acetate and analyzed in triplicate. The amount present in the each tablet was quantified by comparing the area of LIS and HCTZ standards with that of the sample. Dissolution Analysis In-vitro dissolution studies of tablet formulations were carried in 900 mL of 0.1N HCl as dissolution medium using USP XXI type II (Paddle method) Dissolution Rate Test Apparatus (LABINDIA, DS 8000) at 50 rpm. The temperature was maintained constant at 37 ± 0.5°C. Dissolution samples were collected manually at 5, 10, 20, 30, 45 min. At each time point, 5mL sample was removed and filtered through a nylon filter (0.45µm); an aliquot of filtrate was suitably diluted and analyzed by HPLC. The amount of LIS-HCTZ in the test samples was calculated by comparing test the peak area with that of the standard. Filter compatibility study In this study nylon filter (0.45µm) compatibility was evaluated. Sample solution was prepared and the solution was filtered using 0.45µm nylon filter. Filtered samples were injected and chromatograms were observed. The data was given in Table-3. RESULTS AND DISCUSSION Various HPLC, UV, MS, methods were published for the estimation of LIS and HCTZ in combination with other drugs like Nebivilol, Amlodipine besylate, Captopril, Irbesartan but only few methods were reported on the simultaneous quantification of LIS and HCTZ in bulk and dosage forms. Hence, the present investigation was aimed to develop a simple, economical RP-HPLC-PDA method for the determination of LIS and HCTZ in bulk, dosage forms and in dissolution samples. Method Development Mobile phase optimization initially carried with Phenomenex C18 column (250 x 4.6 mm) using water and methanol as mobile phase at different ratios at 1 mL/min flow rate, the LIS and HCTZ were eluted at 4.34 and 3.19 min respectively but the eluted peaks were broad. In another trial 0.02% Formic acid and Acetonitrile (85:15% v/v) was used as mobile phase on Phenomenex C18 column (250 x 4.6 mm) at a flow rate 1mL/min and peaks were monitored at 215nm .Under these conditions, LIS was eluted at 3.04 min and HCTZ had not eluted within the desired run time. In another trail, mobile phase was changed to 10Mm Ammonium acetate and Acetonitrile (75:25%v/v) using Inertsil ODS-3 C18 column and peaks were monitored at 220nm. Under these conditions, LIS and HCTZ peaks were eluted with in desired run time but the LIS peak was not with good symmetry. Finally the mobile phase of 10mM ammonium acetate and acetonitrile was selected at a ratio of 80:20% v/v at flow rate of 1mL/min using ammonium acetate as diluent, under these conditions sharp peaks were obtained with good symmetry and tailing factor was within the limits and the peaks were eluted within 10 min run time. The retention times were 3.7min and 7.6min respectively for LIS and HCTZ. For quantitative analytical purpose wavelength was set at 220 nm, which provided better reproducibility with minimum or no interference. The method was validated as 197
Buchi N. Nalluri et al ______________________________________________________________________________ ______________________________________________________________________________ ______________________________________________________________________________ J. Chem. Pharm. Res., 2013, 5(8): Pharm. Res., 2013, 5(8): 195-202 per ICH guidelines. The peak purity index was found to be greater than 0.9999 and peak purity profiles were shown per ICH guidelines. The peak purity index was found to be greater than 0.9999 in Figure-1 along with UV spectra. Method validation The method has been validated as per ICH Linearity The range of reliable quantification was set at the concentrations of 2 respectively. This range was selected based on 80 analyzed in triplicate. Peak areas and concentrations were subjected to least square regression analysis to calculate regression equation. The correlation coefficient (R) was found to be 0.998 and 0.996 in over the range used. The data from the calibration curve was given in Table and peak purity profiles were shown method has been validated as per ICH-Guidelines for following parameters. The range of reliable quantification was set at the concentrations of 2-10µg/mL and 5-25ug/mL of LIS and HCTZ respectively. This range was selected based on 80-120% of the standard concentration used for accuracy and were analyzed in triplicate. Peak areas and concentrations were subjected to least square regression analysis to calculate regression equation. The correlation coefficient (R) was found to be 0.998 and 0.996 in over the range used. The data from the calibration curve was given in Table-1. 25ug/mL of LIS and HCTZ standard concentration used for accuracy and were analyzed in triplicate. Peak areas and concentrations were subjected to least square regression analysis to calculate regression equation. The correlation coefficient (R) was found to be 0.998 and 0.996 indicating a linear response mAU 220nm,4nm (1.00) 7.4 34 45 40 35 HCTZ 30 25 20 A LIS 15 10 3 .7 3 0 5 0 0.0 1.0 2.0 3.0 4.0 5.0 6.0 7.0 8.0 9.0 min B (HCTZ) B (LIS) mAU 7.50/ 1.00 mAU 3.76/ 1.00 13 35.0 225 204 12 32.5 C (HCTZ) C (LIS) C (LIS) 30.0 11 27.5 10 25.0 9 22.5 8 20.0 271 7 17.5 6 15.0 5 12.5 10.0 4 7.5 3 5.0 2 317 2.5 1 389 0.0 0 -2.5 -1 200.0 225.0 250.0 275.0 300.0 325.0 325.0 350.0 375.0 nm 200.0 225.0 250.0 275.0 300.0 325.0 350.0 375.0 nm Fig 1 Chromatogram of LIS (4µg/mL) and HCTZ (10µg/mL) mixture Chromatogram of LIS (4µg/mL) and HCTZ (10µg/mL) mixture (A); Peak purity curves of LIS and HCTZ of LIS and HCTZ (B) and (C) - UV spectra 198
Buchi N. Nalluri et al ______________________________________________________________________________ J. Chem. Pharm. Res., 2013, 5(8): 195-202 uV 60000 50000 40000 30000 D 20000 C B 10000 A 0 0.0 1.0 2.0 3.0 4.0 5.0 6.0 7.0 8.0 9.0 min Figure 2: Overlay of the Diluent (A) Placebo (B) Standard (C) and Sample (D) chromatograms Precision Precision studies were carried out in terms of repeatability. Repeatability of standard application was assessed by using six replicates of concentration at 10µg/mL level and the data was given in Table-1. The RSD was found to be below 2 for peak areas, this shows the closeness of the data values to each other, indicating the precision of the method. Specificity The specificity of the method was established by injecting the solutions of diluent, placebo, standard, sample (formulation) individually to examine any interference, from the overlay of chromatograms as shown in (Figure-2) and the 3D plots of placebo and formulation in (Figure-4) it can be inferred that there were no co-eluting peaks at the retention time of LIS and HCTZ, this shows that peak of analyte was pure and the excipients in the formulation did not interfere with the analysis and the peak purity indices for sample and standard was found to be greater than 0.999 and this confirms specificity of the method. Accuracy Accuracy of the proposed method was ascertained by performing recovery studies by standard addition method by spiking the known quantities of standard at 80%, 100%, 120% to the drug product solution of 4µg/mL and 10ug/mL and these solutions were analyzed in triplicate in each level of addition. The RSD and the %Recovery were within the acceptable limit in all cases. It is evident from the results of accuracy study given in Table-1, that the proposed method enables very accurate quantitative estimation of LIS and HCTZ. Table 1: Linearity, Precision, Accuracy and Assay data of LIS and HCTZ Validation data of LIS and HCTZ Parameters Range Regression equation Regression coefficient (R2) Correlation coefficient (r) LIS HCTZ 5-25µg/mL Y=59298x-13194 0.996 0.999 2-10µg/mL Y=8709x-943.7 0.998 0.998 Mean % Recovery (RSD) 99.00 (0.50) 94.78 (0.65) 101.80 (1.24) LIS 33423(0.57) 35501.83 (0.81) 5.03 (0.83) Linearity(n=3) Accuracy(n=3) % Level of Addition Mean % Recovery (RSD) 80 100 120 94.23 (0.02) 104.76 (0.93) 101.25 (0.10) HCTZ 418461 (0.15) 588914.2(0.16) 12.73 (0.08) Precision(n=6) System Precision Method Precision Assay in mg (n=3) Average Peak area of the standard sample (RSD) Average peak area of the Assay sample (RSD) Mean ± SD Assay Assay of LISTRIL PLUSTM tablets was performed by the proposed method and the % assay of the formulation was calculated as an average of 3 determinations, which was about 99.82 ± 0.057 and 101.9±0.04 for LIS and HCTZ 199
Buchi N. Nalluri et al ______________________________________________________________________________ J. Chem. Pharm. Res., 2013, 5(8): 195-202 respectively. These results indicate that the present HPLC method can be successfully used for the assay of LIS and HCTZ in bulk and combination dosage forms. Limit of Detection (LOD) and Limit of Quantification (LOQ) LOD and LOQ were determined based on statistical calculation from the calibration curves, where LOD = (3.3 ×σ)/m; LOQ= (10.0×σ)/m (σ is the standard deviation of the y-intercepts of the three regression lines and m is mean of the slopes of the three calibration curves).The limit of detection for LIS and HCTZ was found to be 0.153µg/mL and 0.007ug/mL respectively, the drug peak could be detected without any base line disturbances at this concentration. The limit of quantification for LIS and HCTZ was found to be 0.464 µg/mL and 0.022ug/mL respectively. Robustness As part of the robustness, a deliberate change in the flow rate and wavelength was made to evaluate the impact on the method. Retention times were significantly changed with flow rate and no change in the retention time was observed in wavelength change. Percent assay values were also estimated under these changed conditions and the results were given in Table-2. The parameters like capacity factor, theoretical plate number and assay were not changed and were within the limits. These results indicated that the method is robust in terms of changed flow rate and wavelength. Table 2: Robustness data of LIS and HCTZ Retention time (min) Wavelength (nm) LIS 219 3.71 220 3.71 221 3.71 HCTZ 219 7.35 220 7.35 221 7.35 Flow rate (mL/min) LIS 0.8 4.66 1.0 3.71 1.2 3.71 HCTZ 0.8 9.47 1.0 7.35 1.2 6.29 System suitability System suitability testing is an integral part of the analytical procedure. System suitability studies were carried out by injecting five times a 4µg/mL and 10ug/mL standard concentration of LIS and HCTZ at different injection volumes ranging from 10µL to 50µL. The RSD values for system suitability test parameters like retention time [Rt = 3.7 (1.4)], tailing factor [Tf = 1.1 (0.70) of LIS], [Rt=7.5(1.9)], tailing factor [Tf=1.12(0.30) of HCTZ] and theoretical plate number [120891 (1.80) for LIS and 1651 (1.89) for HCTZ] were less than 2% indicating the present conditions were suitable for the analysis of LIS and HCTZ in tablets. Stability of the stock solution The stability of the stock solution was determined by analyzing the samples under refrigeration (8±1°C) at different time intervals up to 48hrs. The % variation in assay values at different time intervals were found to be less than 2 of the initial zero time interval solution, thus indicating that the solutions were stable for a period of 48hrs when stored at 8±1°C. Dissolution analysis of marketed product The validated method was used for the in vitro dissolution analysis of LIS and HCTZ tablets. The %drug release was found to meet USP specification of NLT 85 (Q) of the labeled amount of LIS and HCTZ dissolved in 30min, proving that the developed method can be successfully applied for the routine in vitro dissolution sample analysis of LIS and HCTZ. The dissolution profile was shown in Figure-3. Tailing factor Drug Composition Theoretical plates (N) 11934 12005 12041 13004 12996 12994 1.32 1.34 1.36 1.12 1.12 1.12 17741 12005 9496 15067 12996 11598 1.44 1.34 1.25 1.13 1.12 1.13 200
Buchi N. Nalluri et al ______________________________________________________________________________ J. Chem. Pharm. Res., 2013, 5(8): 195-202 120 Cumulative% of drugs released 100 80 60 LIS HCTZ 40 20 0 0 10 20 30 40 TIME(mins) Figure 3 Dissolution profiles of LIS and HCTZ in 0.1N HCL Filter compatibility study Compatibility of 0.45µm nylon filter was studied. Standard sample solution and dissolution samples were filtered and analysed and the variation in the assay value was calculated and tabulated in Table-3. After the analysis it was found that nylon filters are suitable for filtration. Table 3: Filter compatibility study Peak area of LIS HCTZ 33738 469567 33620 469460 Sample name % Difference Standard sample Samples filtered through 0.45µm nylon filter - 1.18 1.07 CONCLUSION In this work, a simple and efficient RP-HPLC-PDA method was developed for the simultaneous analysis of LIS and HCTZ in bulk, dosage forms and in dissolution samples of LIS and HCTZ tablets. The method was validated as per International Conference on Harmonisation (ICH) Guidelines, and found to be applicable for routine quality control analysis for the simultaneous estimation of LIS and HCTZ in tablets and in dissolution samples using isocratic binary mode of elution. The results of linearity, precision, accuracy and specificity, proved to be within the limits. The method provides selective quantification of LIS and HCTZ without interference from diluents and placebo. By this method, using USP dissolution conditions it is possible, simply and exactly to determine LIS and HCTZ in dissolution medium without any additional pre-treatment. Therefore, this method can be employed in quality control to estimate the amount of LIS and HCTZ in bulk, dosage forms and in simultaneous analysis of dissolution samples of marketed LIS-HCTZ tablets. Acknowledgements The authors are thankful to Hetero Drugs Ltd, India for providing gift samples and also to the Siddhartha Academy of General and Technical Education, Vijayawada, for providing necessary facilities to carry out the research work. REFERENCES [1]Maryadele JO Neil; The Merck Index. 13th ed. Merck Research Lab publishers, White House Station, NJ, US, 2001, 989(5538), 854(4802). [2]James E. Reynolds. Martindale-The Complete Drug Reference. 32nd ed. Pharmaceutical press, The Royal Pharmaceutical Society, London, 2005, 921, 927. [3]V Chander; M Mohan; R Seth; P Singh; R Singh; S Gupta. Analytical Chemistry letters., 2012, 2(5), 309-313. [4]D Ivanoic; M Medenica; B Jancic; N Knezevic; A Malenovic J Milic..Acta Chromatographica., 2007, No18, 143-145. [5]K Balamuralikrishna; K Mahendra; B SyamaSundar.B. Der Pharma Chemica, 2011, 3(1), 490-496. 201
Buchi N. Nalluri et al ______________________________________________________________________________ J. Chem. Pharm. Res., 2013, 5(8): 195-202 [6]D Varma; A Lakshmana Rao; SC Dinda. Int. J of Pharmaceutical, Chemical And Biological Sciences., 2012, 2(3), 382-391. [7]DW Deepali; D Pradip; DS Jain. Int. Journal of pharma Tech Research., 2012, 4(4), 1570-1574. [8]A Raza; TM Ansari; AU Rahman. Journal of Chinese chem. soc., 2005, 52, 1055-1059. [9]SB Wankhede; MR Tajne; KR Gupta. Indian J Pharm Sci., 2007, 69(2), 298-300. [10]Saqirilio; L Ersoy J chromatographica B Analyte. Technol Biomed life sci., 2004, 809(1), 159-165. [11]N Zhou; YZ Liang; BM Chen; P Wang; X chin; FP Liu. J.chromatogr sci., 2007, 46(10), 848-853. [12]G patel; S Patel, D prajapati; R Mehta. Stamford Journal Pharmaceutical sciences., 2010, 3(1), 49-53. 202