Download
1 / 1
10 likes | 367 Views
Nanoporous Carbon from Corn Cob for Low-Pressure Methane Storage Robert Schott, Demetrius Taylor, Mikael Wood, Peter Pfeifer Department of Physics, University of Missouri, Columbia, MO 65203 Mona-Lisa Banks, Monty Kemiki, Parag Shah, Galen Suppes

E N D
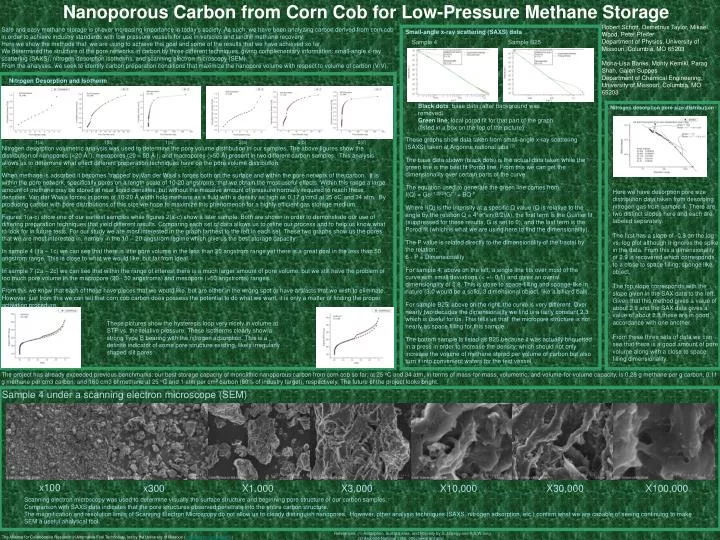
Nanoporous Carbon from Corn Cob for Low-Pressure Methane Storage Robert Schott, Demetrius Taylor, Mikael Wood, Peter Pfeifer Department of Physics, University of Missouri, Columbia, MO 65203 Mona-Lisa Banks, Monty Kemiki, Parag Shah, Galen Suppes Department of Chemical Engineering, University of Missouri. Columbia, MO 65203 Safe and easy methane storage is of ever increasing importance in today's society. As such, we have been analyzing carbon derived from corn cob in order to achieve industry standards with low pressure vessels for use in vehicles and landfill methane recovery. Here we show the methods that we are using to achieve this goal and some of the results that we have achieved so far. We determined the structure of the pore networks in carbon by three different techniques, giving complementary information: small-angle x-ray scattering (SAXS), nitrogen desorption isotherms, and scanning electron microscopy (SEM). From the analyses, we seek to identify carbon preparation conditions that maximize the nanopore volume with respect to volume of carbon (V/V). Small-angle x-ray scattering (SAXS) data Sample 4 Sample B25 Nitrogen Desorption and Isotherm Black dots: base data (after background was removed) Green line: local porod fit for that part of the graph (listed in a box on the top of the picture) Nitrogen desorption pore size distribution These graphs show data taken from small-angle x-ray scattering (SAXS) taken at Argonne national labs (2). The base data shown (black dots) is the actual data taken while the green line is the best fit Porod line. From this we can get the dimensionality over certain parts of the curve. The equation used to generate the green line comes from: I(Q) = Ge(-1/3[QRG]2) + BQ-P Where I(Q) is the intensity at a specific Q value (Q is relative to the angle by the relation Q = 4*π*sin(θ/2)/λ), the first term is the Guinier fit (suppressed for these results, G is set to 0), and the last term is the Porod fit (which is what we are using here to find the dimensionality). The P value is related directly to the dimensionality of the fractal by the relation: 6 - P = Dimensionality For sample 4, above on the left, a single line fits over most of the curve with small deviations (< +/- 0.1) and gives an overal dimensionality of 2.8. This is close to space-filling and sponge-like in nature (3.0 would be a solid, 3 dimensional object, like a billiard ball). For sample B25, above on the right, the curve is very different. Over nearly two decades the dimensionality we find is a fairly constant 2.3 which is useful for us. This tells us that the micropore structure is not nearly as space filling for this sample. The bottom sample is listed as B25 because it was actually briquetted in a press in order to increase the density, which should not only increase the volume of methane stored per volume of carbon but also turn it into convenient wafers for the test vessel. 1(a) 1(b) 1(c) 2(a) 2(b) 2(c) Nitrogen desorption volumetric analysis was used to determine the pore volume distribution in our samples. The above figures show the distribution of nanopores (<20 Å '), mesopores (20 – 50 Å ), and macropores (>50 Å) present in two different carbon samples. This analysis allows us to determine what effect different preperation techniques have on the pore volume distribution. When methane is adsorbed it becomes 'trapped' by Van der Waal's forces both on the surface and within the pore network of the carbon. It is within the pore network, specifically pores on a length scale of 10-20 angstroms, that we obtain the most useful effects. Within this range a large amount of methane may be stored at near liquid densities, but without the massive amount of pressure normally required to reach these densities. Van der Waals forces in pores of 10-20 Å width hold methane as a fluid with a density as high as 0.17 g/cm3 at 25 oC and 34 atm. By producing carbon with pore distributions of this size we hope to maximize this phenomenon for a highly efficient gas storage medium. Figures 1(a-c) show one of our earliest samples while figures 2(a-c) show a later sample. Both are shown in order to demonstrate our use of differing preparation techniques that yield different results. Comparing each set of data allows us to refine our process and to help us know what to look for in future tests. For our study we are most interested in the graph farthest to the left in each set. These two graphs show us the pores that we are most interested in, namely in the 10 – 20 angstrom regime which give us the best storage capacity. In sample 4 (1a – 1c) we can see that there is little pore volume in the less than 20 angstrom range yet there is a great deal in the less than 50 angstrom range. This is close to what we would like, but far from ideal. In sample 7 (2a – 2c) we can see that within the range of interest there is a much larger amount of pore volume, but we still have the problem of too much pore volume in the macropore (20 - 50 angstroms) and mesopore (>50 angstroms) ranges. From this we know that each of these have pieces that we would like, but are either in the wrong spot or have artifacts that we wish to eliminate. However, just from this we can tell that corn cob carbon does possess the potential to do what we want, it is only a matter of finding the proper activation procedure. Here we have desorption pore size distribution data taken from desorbing nitrogen gas from sample 4. There are two distinct slopes here and each are labeled separately. The first has a slope of -0.9 on the log vs. log plot although it ignores the spike in the data. From this a dimensionality of 2.9 is recovered which corresponds to a close to space filling, sponge like object. The top slope corresponds with the slope given in the SAX data to the left. Given that this method gives a value of about 2.9 and the SAX data gives a value of about 2.8 these are in good accordance with one another. From these three sets of data we can see that there is a good amount of pore volume along with a close to space filling dimensionality. These pictures show the hysteresis loop very nicely.in volume at STP vs. the relative pressure. These isotherms clearly show a strong Type B bearing with the nitrogen adsorption. This is a definite indicator of some pore structure existing, likely irregularly shaped slit pores(1). The project has already exceeded previous benchmarks: our best storage capacity of monolithic nanoporous carbon from corn cob so far, at 25 oC and 34 atm, in terms of mass-for-mass, volumetric, and volume-for-volume capacity, is 0.28 g methane per g carbon, 0.11 g methane per cm3 carbon, and 160 cm3 of methane at 25 oC and 1 atm per cm3 carbon (90% of industry target), respectively. The future of the project looks bright. Sample 4 under a scanning electron microscope (SEM) x100 x300 X1.000 X3,000 X10,000 X30,000 X100,000 Scanning electron microscopy was used to determine visually the surface structure and beginning pore structure of our carbon samples. Comparison with SAXS data indicates that the pore structures observed penetrate into the entire carbon structure. The magnification and resolution limits of Scanning Electron Microscopy do not allow us to clearly distinguish nanopores. However, other analysis techniques (SAXS, nitrogen adsorption, etc.) confirm what we are capable of seeing continuing to make SEM a useful analytical tool. References: (1) Adsorption, Surface area, and Porosity by S.J.Gregg and K.S.W.Sing (2) Argonne National Labs: http://www.anl.gov/ The Alliance for Collaborative Research in Alternative Fuel Technology, led by the University of Missouri (http://all-craft.missouri.edu)