Download
1 / 34
340 likes | 493 Views
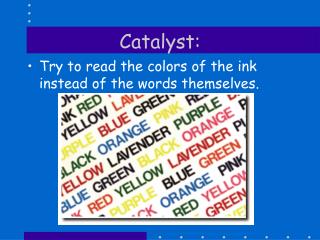
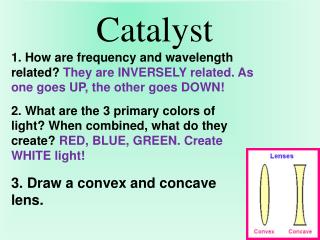
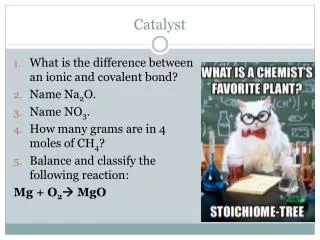
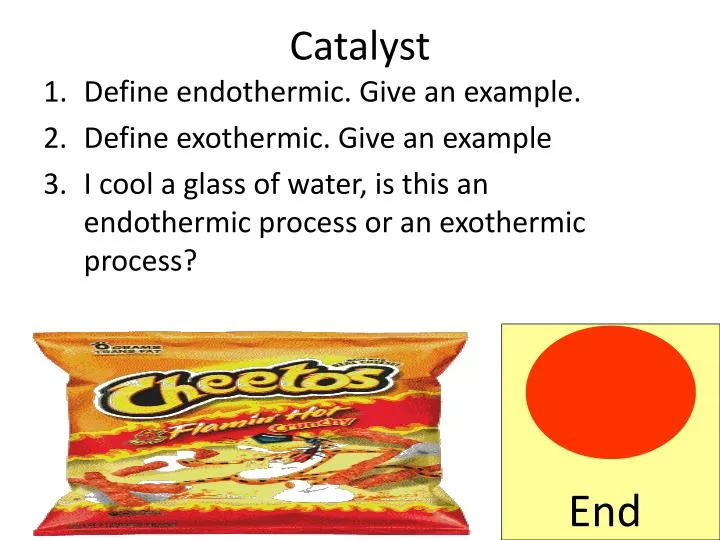
Catalyst. Define endothermic. Give an example. Define exothermic. Give an example I cool a glass of water, is this an endothermic process or an exothermic process?. End. Lecture 7.2 – Heating Curves and Phase Diagrams. Today ’ s Learning Targets.

E N D
Catalyst • Define endothermic. Give an example. • Define exothermic. Give an example • I cool a glass of water, is this an endothermic process or an exothermic process? End
Today’s Learning Targets • 7.3 – I can draw a phase diagram to describe how pressure and temperature are related and discuss what a triple point is. • 7.4 – I can analyze and draw a heating curve to describe how energy is lost or gained while a substance changes phases. I can identify on the graph the Hfusion and the Hvaporization. • 7.5 – I can describe a reaction using the ideas of enthalpy and entropy.
Today’s Focus Question • How much energy is required to turn my Flamin’ Hot Cheetos into a liquid?
I. Enthalpy (ΔH) • Enthalpyis a measure of the total energy that a system has. • Amount of energy released or absorbed during a process/reaction. • Measured in kilojoules (kJ)
II. Entropy (ΔS) • The universe tends towards disorder. • Entropyis the measurement of the randomness or disorder of a system. • More energy = more disorder • Measure in J/K
I. ΔHfusion and ΔHvaporization • Large amount of energy that is required to change phases • ΔHfusion= Energy to change solid to a liquid. • ΔHvaporization= Energy to change liquid to a gas. • ΔHfreezing= Energy to change liquid to a solid • ΔHcondensation= Energy to change gas to a liquid
II. Heating Curves • Heating curves are graphs of the relationship between temperature and time. • Allow us to identify important values
ΔH of vaporization/condensation ΔH of fusion/freezing
Justify – TPS • Why was the water able to boil at room temperature when we dropped the pressure?
I. Pressure and Temperature • The state of matter of a substance depends on both the temperature and pressure • A phase diagram is a graph temperature, pressure, and phase for a substance
II. Important Points on a Phase Diagram • Triple Point – The temperature and pressure conditions at which the solid, liquid, and gas phases of a substance coexist • Critical Point – The temperature and pressure at which the gas and liquid state become identical and form one phase.
Melting/Fusion Freezing Vaporization Condensation Sublimation Deposition
Class Example • You have a solid at a pressure of 30 atm and -15 oC, if you decrease the pressure at constant temperature, what phases will the substance go through?
Stop and Jot • Atmospheric pressure on Mt. Everest is 0.29 atm. What is the boiling point of water there using the phase diagram below.
Vocab Direct Instruction Assignment • With our group, let’s do some vocab definitions! • Make a power point defining each of these terms: • Enthalpy • Entropy • Δhfusion • Δhvaporization • ΔHfreezing • Make a powerpoint slide for each vocab word with a picture, title, and a definition! • Δhcondensation • Heating curves • phase diagram • Critical Point • Triple Point
Collaborative - Let’s Heat Some Water! • With the table complete the heating curve lab activity. • Heat the ice until it reaches a rolling boil • Show Mr. Astor when you are done
Independent Work Time Complete the phase diagram homework you picked up when you came in.
Learning Log Assessment Rate yourself 1 – 4 on LTs 7.3, 7.4, and 7.5
Exit Slip • What is entropy? • Draw a basic heating curve. Have temperature on the y-axis and heat added on the x-axis. Label solid, liquid, gas, boiling, and freezing. • What is the triple point on the graph below?
Learning Log Assessment Rate yourself 1 – 4 on LTs 7.3, 7.4, and 7.5
Closing Time • Homework 7.2 due Monday/Tuesday • Rough Draft Due Monday/Tuesday • Quiz on Cheetos lab Monday/Tuesday