Download
1 / 23
320 likes | 774 Views
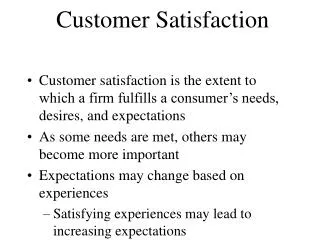
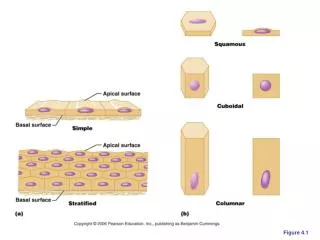
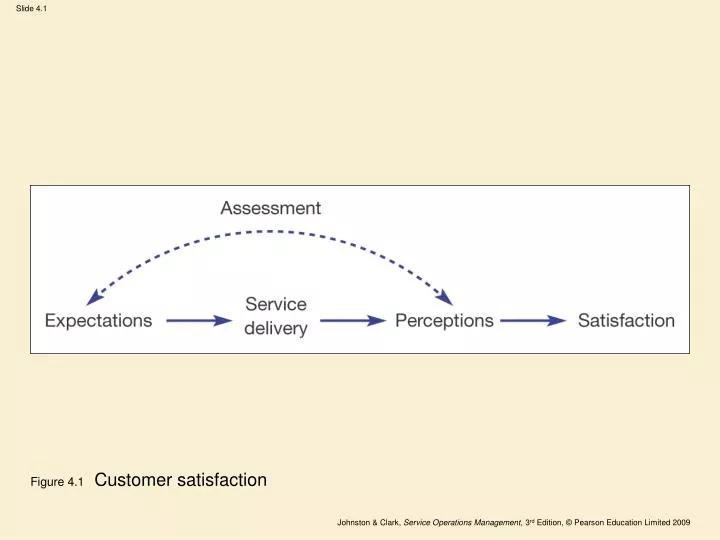
Figure 4.1 Customer satisfaction. Figure 4.2 The satisfaction continuum. Figure 4.3 Simplified gap model. Table 4.1 Reasons for gaps. Figure 4.4 Range of expectations. Figure 4.5 Range of expectations and the zone of tolerance or acceptable outcomes.

E N D
Figure 4.5Range of expectations and the zone of tolerance or acceptable outcomes
Figure 4.8 Delighting and dissatisfying factorsAdapted from Lockwood, Andrew (1994) ‘Using service incidents to identify quality improvement points’, International Journal of Contemporary Hospitality Management, 6 (1/2) 75–80. Reprinted by permission ofEmerald Group Publishing Limited, www.emerald insight.com/ijchm.htm.
Figure 4.10 Delight versus dissatisfactionAdapted from Johnston, Robert (1995) ‘The determinants of service quality: satisfiers and dissatisfiers’, International Journal of Service Industry Management, 6 (5) 53–71. Reprinted by permission of Emerald GroupPublishing Limited, www.emerald insight.com/ijsim.htm.
Figure 4.11Importance of various aspects of a hotel – staff and guests
Figure 4.12Managing perceptions during the processAdapted from Johnston, Robert (1995) ‘The zone of tolerance: exploring the relationship between service transactions and satisfaction with the overall service’, International Journal of Service Industry Management, 6 (2)46–61. Reprinted by permission of Emerald Group Publishing Limited, www.emerald insight.com/ijsim.htm.
Figure 4.13Managing perceptions at a clinicAdapted from Johnston, Robert (1995) ‘The zone of tolerance: exploring the relationship between service transactions and satisfaction with the overall service’, International Journal of Service Industry Management, 6 (2)46–61. Reprinted by permission of Emerald Group Publishing Limited, www.emerald insight.com/ijsim.htm.
Figure 4.14Adequate performance satisfies the customerAdapted from Johnston, Robert (1995) ‘The zone of tolerance: exploring the relationship between service transactions and satisfaction with the overall service’, International Journal of Service Industry Management, 6 (2)46–61. Reprinted by permission of Emerald Group Publishing Limited, www.emerald insight.com/ijsim.htm.
Figure 4.15Using enhancers to delight the customerAdapted from Johnston, Robert (1995) ‘The zone of tolerance: exploring the relationship between service transactions and satisfaction with the overall service’, International Journal of Service Industry Management, 6 (2)46-61. Reprinted by permission of Emerald Group Publishing Limited, www.emerald insight.com/ijsim.htm.
Figure 4.16 A dissatisfying outcomeAdapted from Johnston, Robert (1995) ‘The zone of tolerance: exploring the relationship between service transactions and satisfaction with the overall service’, International Journal of Service Industry Management, 6 (2)46-61. Reprinted by permission of Emerald Group Publishing Limited, www.emerald insight.com/ijsim.htm.
Figure 4.17 Enhancers compensate for failureAdapted from Johnston, Robert (1995) ‘The zone of tolerance: exploring the relationship between service transactions and satisfaction with the overall service’, International Journal of Service Industry Management, 6 (2)46-61. Reprinted by permission of Emerald Group Publishing Limited, www.emerald insight.com/ijsim.htm.
Figure 4.18Dissatisfaction shifts the zone of toleranceAdapted from Johnston, Robert (1995) ‘The zone of tolerance: exploring the relationship between service transactions and satisfaction with the overall service’, International Journal of Service Industry Management, 6 (2)46-61. Reprinted by permission of Emerald Group Publishing Limited, www.emerald insight.com/ijsim.htm.
Figure 4.19Delight shifts the zone of toleranceAdapted from Johnston, Robert (1995) ‘The zone of tolerance: exploring the relationship between service transactions and satisfaction with the overall service’, International Journal of Service Industry Management, 6 (2)46-61. Reprinted by permission of Emerald Group Publishing Limited, www.emerald insight.com/ijsim.htm.
Figure 4.21Assignment of relative importance of service factors – patients
Figure 4.22Assignment of relative importance of service factors – staff