Download
1 / 12
0 likes | 3 Views
Master Power BI Training in Hyderabad with expert led sessions! Enroll at the Best Power BI Institute in Ameerpet for hands on learning job placement

E N D
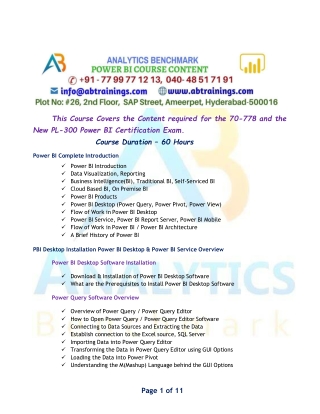
This Course Covers the Content required for the 70-778 and the New PL-300 Power BI Certification Exam. Course Duration – 60 Hours Power BI Complete Introduction Power BI Introduction Data Visualization, Reporting Business Intelligence(BI), Traditional BI, Self-Serviced BI Cloud Based BI, On Premise BI Power BI Products Power BI Desktop (Power Query, Power Pivot, Power View) Flow of Work in Power BI Desktop Power BI Service, Power BI Report Server, Power BI Mobile Flow of Work in Power BI / Power BI Architecture A Brief History of Power BI PBI Desktop Installation Power BI Desktop & Power BI Service Overview Power BI Desktop Software Installation Download & Installation of Power BI Desktop Software What are the Prerequisites to Install Power BI Desktop Software Power Query Software Overview Overview of Power Query / Power Query Editor How to Open Power Query / Power Query Editor Software Connecting to Data Sources and Extracting the Data Establish connection to the Excel source, SQL Server Importing Data into Power Query Editor Transforming the Data in Power Query Editor using GUI Options Loading the Data into Power Pivot Understanding the M(Mashup) Language behind the GUI Options Page 1 of 11
Power Pivot Software Overview Understanding about Power Pivot – A In Memory Columnar Database Advantage of In Memory Columnar Database Power Pivot - xVelocity In-memory Analytics Engine (Previously called Vertipaq) Overview of Data Modeling – Model View(Previously Relationship View) Enhancing the Data Model – DAX(Data Analysis eXpressions) Language – Data View Power View Software Overview Overview of Visualizations, Fields, Field Wells Understanding Dimension Columns & Fact Columns Visualizing the Data using Power View and Power Maps – Report View Saving Report Publishing the Report to Power BI Service Power BI Service Overview Power BI Service Overview Logon to Power BI Service Share the Reports with Clients Power BI Desktop User Interface Understanding Power BI Desktop User Interface Fields Pane, Visualizations Pane, Filters Pane Ribbon, Multiple Views (Report View, Data View & Model View) Report Canvas, Pages Section Building Blocks of Power BI Datasets, Visualizations, Reports, Dashboards & Tiles Power Query Introduction to Power Query & Power Query Editor User Interface Overview of Power Query / Query Editor How to Open Power Query / Query Editor Extracting the Data from Data Sources Transforming the Data using GUI Options Loading the Data in Power Pivot Query Editor UI(Queries Pane, Data Pane / Results Pane, Power Query Ribbon) Query Settings, Pane Applied Steps, Formula Bar Advanced Editor, Query Dependencies Understanding Power Query Conceptually Page 2 of 11
Data Processing, Data types and Filters in Power Query How Data Processed in Power Query Data types, Changing the Data type of a Column, Detect Data Type Filters in Power Query and their Purpose Types of Filters in Power Query(Basic Filtering, Advanced Filtering) Auto Filter / Basic Filtering Filter a Column using Advanced Text Filters, Number Filters, Date Filters Filter Multiple Columns Inbuilt Column Transformations Remove Columns / Remove Other Columns, Choose Columns, Go To Column Name or Rename a Column Reorder Columns or Sort Columns(Move Left, Right, To Beginning, To End) Column from Examples( From All Columns, From Selection) Add Column / Custom Column Duplicate Column, Split Column, Merge Columns PIVOT, UNPIVOT Columns, Transpose Columns Replace Values, Remove Empty In built Row Transformations Header Row or Use First Row as Headers, Use Headers as First Row Keep Top Rows, Keep Bottom Rows, Keep Range of Rows Keep Duplicates, Keep Errors Remove Top Rows, Remove Bottom Rows, Remove Alternative Rows Remove Duplicates, Remove Blank Rows, Remove Errors Group Rows / Group By Combine Queries (Merge Queries & Append Queries) Merge Queries / Join Tables Merge Queries, Merge Queries as New Need of Merge Queries, Minimum requirements to Perform Merge Queries Types of Joins / Join Kinds / Merge Type Left Outer (all from first, matching from second) Right Outer (all from second, matching from first) Full Outer (all rows from both) Inner (only matching rows) Left Anti (rows only in first), Right Anti (rows only in second) Cartesian Join or Cross Join, Self-Join Merging the Tables using Multiple Join Conditions How to Merge 3 Tables Use Fuzzy Matching Option Page 3 of 11
Append Queries / Union ALL Tables Append Queries, Append Queries as New Minimum requirements to perform Append Queries Append Two Tables , Append Three or More Tables Folder as Source Appending Multiple Files of same type from a folder using Single Query Appending Multiple Excel Files and Multiple Sheets using Single Query Union All, How to get Union Result Query Options Copy Query, Paste Query, Delete Query, Rename Query Enable Load, Include in report Refresh Duplicate Query, Reference Query Move to Group, Move Up, Move Down Create Function, Convert To Parameter Advanced Editor, Properties Home Tab Options Close & Apply, Apply, Close New Source, Recent Sources, Enter Data, Data Source Settings Manage Parameters( Manage Parameters, Edit Parameters, New Parameter) Suggested Values(Any Value, List of Values, Query), Convert to List Query Parameters and Power BI Templates .pbix(Power BI File) and .pbit(Power BI Template File) Refresh Preview, Refresh All, Cancel Refresh Sorting Data Transform Tab Options Reverse Rows, Count Rows, Replace Values, Replace Errors, Fill Down, Fill Up Text Column, Number Column, Date & Time Column Options Structured Column(Expand, Aggregate, Extract Values) Run R Script, Run Python Script Add Column Tab Options Create Custom Function, Invoke Custom Function Conditional Column, Index Column, Duplicate Column From Text, From Number, From Date & Time Column Options View Tab, Tools Tab & Help Tab Options Page 4 of 11
Power Pivot Power Pivot Software Overview Understanding about Power Pivot – A In Memory Columnar Database Advantage of In Memory Columnar Database Power Pivot - xVelocity In-memory Analytics Engine (Previously called Vertipaq) Overview of Data Modeling – Model View(Previously Relationship View) Enhancing the Data Model – DAX(Data Analysis eXpressions) Language – Data View Power BI Data Modeling – Model View (Previously Relationship View) Data Modeling Introduction Relationships, Need of Relationship Between Tables Dimension Column, Fact Column, Dimension Table, Fact Table Star Schema, Snowflake Schema Galaxy Schema or Hybrid Schema or Fact Constellation Schema Relationship Types / Cardinality in General One-to-One, One-to-Many (or Many-to-One), Many-to-Many AutoDetect the relationship, Create a new relationship Edit existing relationships, Delete a relationship Make Relationship Active or Inactive Cross filter direction (Single, Both), Apply Security Filter in Both Directions Assume Referential Integrity Enhancing the Data Model - DAX What is DAX(Data Analysis eXpressions) Language – Functional Language New Column, New Measure / Quick Measure, New Table DAX Table and Column Name Syntax Creating New Column, Creating New Measure Implicit Measures, Explicit Measures Difference Between New Columns & New Measures DAX Operators, Types of Operators Arithmetic Operators, Comparison Operators Text Concatenation Operator, Logical Operators DAX Functions - Categories Text Functions Logical Functions Date and Time Functions Filter Functions Math & Statistical Functions Time Intelligence Functions Page 5 of 11
DAX Text Functions LEN, CONCATENATE (&) LEFT, RIGHT, MID UPPER, LOWER TRIM, SUBSTITUTE, REPLACE, BLANK DAX Logical Functions IF, Nested IF TRUE, FALSE, NOT, OR, IN, AND IFERROR SWITCH DAX Date & Time Functions Creating Date Dimension Table for performing Time Intelligence Analysis YEAR, QUARTER, MONTH, DAY WEEKDAY, WEEKNUM FORMAT (Text Function) Month Name, Weekday Name DATE, TODAY, NOW HOUR, MINUTE, SECOND, TIME DATEDIFF, YEARFRAC, CALENDAR, CALENDARAUTO EDATE, EOMONTH, DATEVALUE Week Number of Month, Fiscal Year, Fiscal Quarter DAX Filter Functions CALCULATE, CALCULATETABLE ALL, ALLSELECTED, ALLEXCEPT RELATED, RELATEDTABLE LOOKUPVALUE (Information function) USERELATIONSHIP FILTER, DISTINCT(Column), DISTINCT(Table), VALUES, SELECTEDVALUE DAX Math and Statistical Functions INT, ROUND, ROUNDUP, ROUNDDOWN DIVIDE, EVEN, ODD, POWER, SIGN, SQRT, FACT SUM, SUMX, MIN, MINX, MAX, MAXX, COUNT, COUNTX AVERAGE, AVERAGEX COUNTROWS, COUNTBLANK RANKX, SUMMARIZE Page 6 of 11
DAX Time Intelligence Functions Time Intelligence Introduction Date Dimension Table, Mark as Date Table TOTALMTD, TOTALQTD, TOTALYTD PREVIOUSDAY, PREVIOUSMONTH, PREVIOUSQUARTER, PREVIOUSYEAR NEXTDAY, NEXTMONTH, NEXTQUARTER, NEXTYEAR SAMEPERIODLASTYEAR YOY Growth, QOQ Growth, MOM Growth FIRSTDATE, LASTDATE Quick Measures Creating Measures without writing the DAX Formula using Quick Measures Sales YoY%, Sales YTD, Sales MTD Power View Report View / Power View Report View User Interface / Power BI Desktop User Interface Fields Pane, Visualizations pane, Filters Pane Ribbon, Multiple Views, Report Canvas, Pages Section Fields, Filed Wells, Formatting, Analytics Visuals Interactions Visual Interactions Interaction Type (Highlight, Filter, None) Visual Interactions Default Behavior Changing the Default Interaction Behavior, Edit Interactions Filters in Power View Filters, Filter Types in Power View Filters on this Visual, Filters on this Page, Filters on All Pages Drill Through Filters, Cross Report Drill Through, Keep All Filters Filter Sub Types - Basic Filtering, Advanced Filtering, Top N, Relative Date Filtering Numeric field filters, Text field filters, Date and Time field Filters Hierarchies and Drill-Down Reports Hierarchy Introduction, Default Date Hierarchy Creating Hierarchy, Creating Custom Date Hierarchy, Change Hierarchy Levels Drill Actions - Drill Down, Drill Up, Show Next Level, Expand Next Level Apply Drill Down filters to Selected Visual Page 7 of 11
Power BI Visualizations Visualizing Data, Why Visualizations Visualization types, Field Wells Visuals for Filtering, Visualizing Categorical Data, Visualizing Trend Data Visualizing KPI Data, Visualizing Tabular Data, Visualizing Geographical Data Leveraging Power BI Custom Visuals Visuals for Filtering Slicer Visualization, When to use a Slicer Create and format Slicer Visualization Hierarchy Slicer (Custom Visualization) When to use a Hierarchy Slicer, Create and format Hierarchy Slicer Advantages of Hierarchy Slicer Play Axis (Dynamic Slicer) - Custom Visualization When to use a Play Axis Visual, Create and format Play Axis Visual Visualizing Categorical Data Purpose of Pie and Donut Charts, Create and Format Pie and Donut Charts Purpose of Tree map Visual, Create and Format the Tree Map Visual Purpose of Bar & Column Charts Create and Format Bar and Column Charts Create and Format Stacked Bar Chart, Stacked Column Chart Create and Format Clustered Bar Chart, Clustered Column Chart Create and Format 100% Stacked Bar Chart, 100% Stacked Column Chart Purpose of Scatter Chart, Create and Format Scatter Chart Visualizing Trend Data Purpose of Line and Area Charts Create and Format Line Chart, Area Chart, Stacked Area Chart Combo Charts Create and Format Line and Stacked Column Chart, Line and Clustered Column Chart Create and Format Ribbon Chart, Waterfall Chart Visualizing KPI Data Create and Format Gauge Visual, KPI Visual Create and Format Card Visualization, Multi Row Card Create and Format Funnel Chart Visualizing Tabular Data Create and Format Table Visual, Matrix Visualization Visualizing Geographical Data Create and Format Map Visual, Filled Map Visual Page 8 of 11
Grouping, Binning & Sorting Grouping and Binning Introduction Using grouping, Creating Groups on Text Columns Using binning, Creating Bins on Number Column and Date Columns Sorting Data in Visuals, Changing the Sort Column, Changing the Sort Order Sort using column that is not used in the Visualization Sort using the Sort by Column button Tooltip Page Create a Report Tooltip Page, Configure your Tooltip Report Page Manually setting a Report Tooltip Bookmarks, Selection Pane & Buttons Bookmarks, Selection Pane & Buttons Changing the chart type dynamically Changing the Axis of Chart Dynamically Power BI Service Power BI Service Introduction Power BI Service Introduction, Power BI Cloud Architecture Cloud Vs. On Premise Creating Power BI Service Account, SIGN IN to Power BI Service Account Power BI Pro & Power BI Premium My Workspace & Project Workspace Adding Dataset to Power BI Service and Creating Multiple New Reports Publishing Reports to the Power BI service, Import / Getting the Report to PBI Service Creating Multiple Reports using Dataset Power BI Datasets Live Connection using Desktop to Create New Report Creating New Reports in Cloud using Published Datasets Shared and Certified Datasets, Sharing Dataset across Multiple Projects Dashboards Development Dashboard, Creating Dashboards using Multiple Reports Pin Visuals and Pin LIVE Report Pages to Dashboard Advantages of Dashboards Interacting with Dashboards Adding Tiles to Dashboards Web Content, Image, Text Box, Video Formatting Dashboard Page 9 of 11
Building Blocks of Power BI Datasets, Visualizations, Reports, Dashboards & Tiles Data Connectivity Modes in Power BI Import, Direct Query & Connect Live / Live Installing & Configuring the Data Gateways Introduction to Data Gateways, How Data Gateways work Connect to an on premise Data Source by using a Data Gateway Download Data Gateway, Installing a Data Gateway Types of Gateways – Enterprise & Personal Gateway Difference Between Enterprise & Personal Gateway Manage Data Gateway Sharing the Gateway, Add and Remove Administrators Add Data Source, Add or Remove Users to a Data Source Refresh On Premise Data Configuring Automatic Refresh using Schedules Full Refresh / Truncate & Load , Incremental Refresh the Data in Dataset Understanding Sub folder in Workspace Datasets + Dataflows - Dataflows, Datasets Content - Workbooks, Reports & Dashboards All - Dataflows, Datasets, Workbooks, Reports & Dashboards Dataflows Dataflows, Purpose of Dataflows Creating and Working with Dataflows Using Dataflows to Create a Dataset in Power BI Desktop Power BI Architecture with Dataflows Dataset Actions Refresh, Schedule Refresh, Analyze in Excel, Create Report Delete Dataset, Get Quick Insights, Security, Rename, Settings, Download .pbix Manage Permissions, View Lineage Excel Workbooks Import Excel Data into Power BI as Dataset Upload you Excel file to Power BI Report Actions Share, Mark as Favorite, Analyze in Excel, Delete, Quick Insights, Save a Copy, Settings View usage Metrics Report, View Lineage Dashboard Actions Share, Mark as Favorite, Delete, Settings, View usage Metrics Report, View Lineage Page 10 of 11
Team Collaboration in Power BI using Workspaces Introduction to Workspaces Classic Workspaces, Upgraded Workspaces Create an Workspace, Add Members to Workspace to Collaborate Workspace Access - Admin, Member, Contributor, Viewer Roles Sharing Power BI Content using Basic Sharing, Content Packs and Apps Sharing Reports & Dashboards using Direct Sharing / Basic Sharing Content Pack Introduction Create Content Pack, Sharing Content Packs Specific Groups, My Entire Organization Selecting the Content / Items to Publish or Share Introduction to App Publish an App, Update a Published App Manage Content in App, Include in App, Exclude in App Sharing App Entire Organization, Specific individuals or group Un publishing an App Row Level Security in Power BI Introduction to Row Level Security Row Level Security (RLS) with DAX Manage Roles, Creating Roles, Testing Roles Adding Members to Roles in Power BI Service Dynamic Row Level Security Creating Users Table and Adding to the Model Capturing users using UserName () or UserPrincipalName () DAX Functions Syncing Published Power BI Report Files Using OneDrive Refresh a Dataset stored on OneDrive Schedule Refresh the Dataset stored on OneDrive Deployment Pipelines Create a Deployment Pipeline Assign a workspace to a Deployment Pipeline ADD ON Real-time Project Explanation Resume Preparation, Power BI Developer Roles & Responsibilities Interview Questions Discussions Mock Interviews Page 11 of 11
Power BI Course Details Power BI Topics Covered : Mr. Sunil Kumar Trainer Name Power Query --> 15 Hrs Total Experience : 11+ Years Power Pivot --> 15 Hrs Power BI Experience : 6+ Years Power View --> 15 Hrs Course Duration : 60 Days / Daily 1 Hour Power BI Service --> 15 Hrs Available Batch Timings Batch 1 : Morning 7:00 - 8:00 AM Demos (Offline / Online) Day : Every Saturday & Tuesday Batch 2 : Morning 9:00 - 10:00 AM Time : 11 AM(IST) Batch 3 : Evening 7:30 - 8:30 PM * * * First 3 Classes are Free * * * Lab Timings * *Support Team * * Morning 7:00 AM to Evening 9:00 PM Support team Available to Clear Support Team Available in LAB Doubts From 9:00 AM - 6:00 PM To Clarify Your Questions Online / Offline * * * ADD ON * * * 1.All Recording Videos 2.Daily Class Notes 3.Word Documents (Power BI - Material) 4.Realtime Project 5.Resume Preparation 6.Power BI Developer Roles & Responsibilities 7.Interview Questions Discussions 8.Mock Interviews Page 12 of 11