Download
1 / 34
390 likes | 1.25k Views
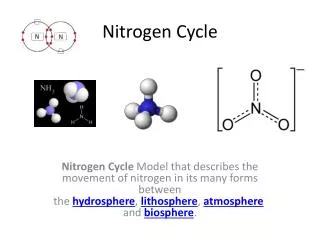
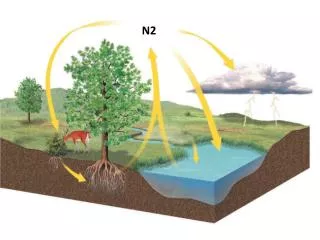
Nitrogen Cycle. Most of Nitrogen is in the atmosphere. 14 N = 99.6% 15 N = 0.4% Air is standard for d 15 N Range is –20 to +20 ‰ . Assimilation and Dissimilation Nitrogen Cycling Pathways. Assimilation NO 3 and NH 4 uptake (NO 3 or NH 4 org N) N 2 Fixation (N 2 org N)

E N D
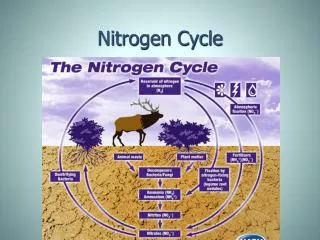
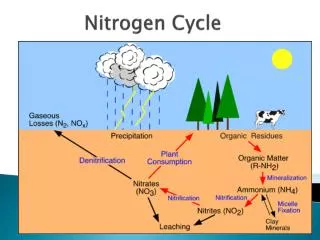
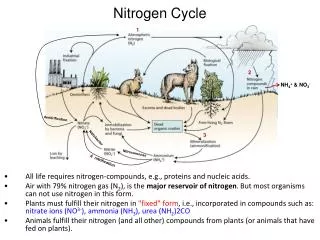
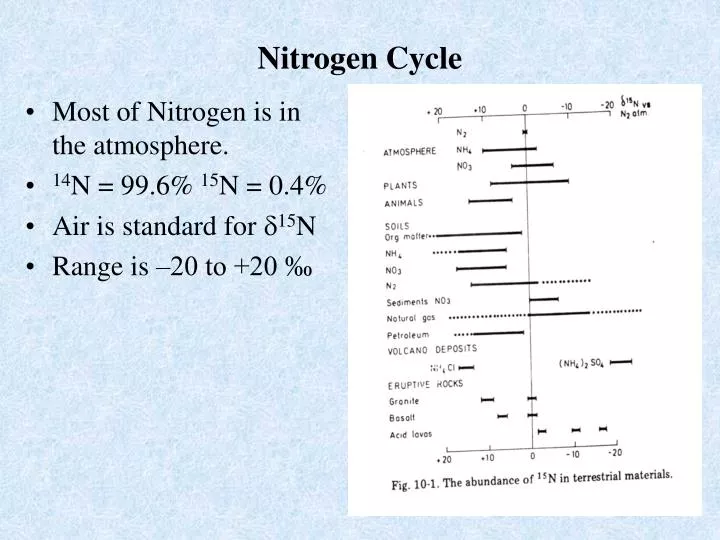
Nitrogen Cycle • Most of Nitrogen is in the atmosphere. • 14N = 99.6% 15N = 0.4% • Air is standard for d15N • Range is –20 to +20 ‰
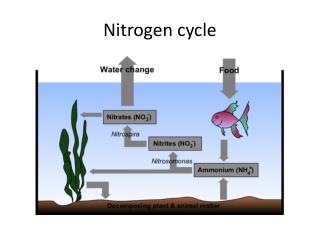
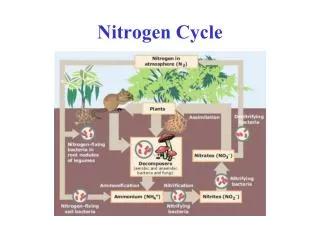
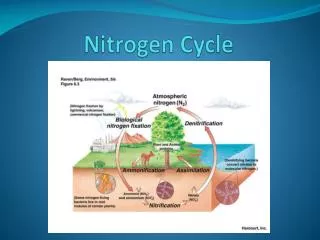
Assimilation and Dissimilation Nitrogen Cycling Pathways Assimilation NO3 and NH4 uptake (NO3 or NH4 org N) N2 Fixation (N2 org N) Dissimilation -Mineralization (org N NH4) -Nitrification (NH4 NO3) -Denitrification (NO3 N2) -Anammox (NO2 + NH4 N2) (in marine systems)
d15N Range in Terrestrial Plants Non N-fixers = -6 to +6 ‰ N-Fixers = 0±3 ‰
KIE during Nitrate Assimilation by Terrestrial Plants • Large range of KIE values measured in culture experiments • Range: - 3 to –24 ‰ (Mariotti, 1980) -3 to –7 ‰ (Kohl and Shearer, 1980) -0.3±0.6 ‰ (38 species) (Mariotti, 1982) • Measured KIE depends significantly on culture conditions (growth rate, NO3 concentration) • Typically, KIE increased with increased nitrate concentration.
N2 Fixation in Plants • Plants have d15N = 0±3 ‰ similar to d15N of N2 in air. -molecular diffusion of N2 is air (soil pockets) yields KIE = -9 ‰. N2 diffusion in water has KIE = -1.3 ‰ -also you would expect a significant KIE during the breaking of a N-N bond to convert to NH4 -this seems to imply that aqueous N2 diffusion limits N2 fixation. What other explanation? • Haber Process (N2 + 3H2 2NH3) yields commercial fertilizers with d15N of ~ 0±3 ‰ (high temp (>300ºC) and complete conversionlittle KIE)
KIE during NO3 and NH4 Uptake in Plankton Cultures KIE ranged from 0 to –15 ‰ with a mean of ~ –7 ‰
Effect of growth rate of KIE in cultures NO3 Substrate NO3 Substrate NH4 Substrate + A A As growth rate increased, KIE decreased. High concentrations (mmolar) of NO3 and NH4.
KIE during N2, NO3 and NH4 uptake (same species Anabaena) KIEs N2 = -2 ‰ NO3 = -11 to –13 ‰ NH4 = -14 ‰
KIE during NO3 assimilation under closer to ambient concentrations (uM vs mM) How useful are culture derived KIEs?
d15N variations in marine plankton Three Ocean Regimes NO3 replete (I) NO3 limited (II) N2 fixation (III)
d15N of Plankton (PON) in Mixed Layer depends on NO3 Concentration
Effect of KIE on d15N of NO3 Sta Papa Southern Ocean KIE during nitrate assimilation enriches d15N of remaining NO3 pool Both regions yields a KIE = -9.1 ‰. What is advantage of this approach?
d15N of NH4 in Delaware Estuary KIE for NH4 uptake = -20±? ‰ (Rayleigh) -NH4 uptake -nitrification -sewage NH4 input
Summary of KIE during N Assimilation How useful are culture KIE determinations?
Steps in nitrate assimilation ~15 ‰ offset between internal and external NO3 pools
d15N based N Budget at ALOHA and BATS ALOHA near Hawaii BATS near Bermuda At ALOHA, N2 fixation contributes 50% of new nitrogen. At BATS, N2 fixation is a negligible N source.
Assimilation and Dissimilation Nitrogen Cycling Pathways Assimilation NO3 and NH4 uptake (NO3 or NH4 org N) N2 Fixation (N2 org N) Dissimilation -Mineralization (org N NH4) -Nitrification (NH4 NO3) -Denitrification (NO3 N2) -Anammox (NO2 + NH4 N2) (in marine systems)
d15N of OM trends in soils d15N vs %N Are these trends a result of KIE during remineralization? d15N vs C/N
d15N of NO3 and NH4 released during a Soil Incubation Experiment The NO3 produced during OM degradation is 15N depleted, whereas the NH4 is enriched (initially) relative to OM. Complicated interpretation because there is OM mineralization, nitrification and denitrification occurring simultaneously, all of which likely have different KIEs. NO3 NH4 d15N
d15N of Organic N in Sediment Traps N. Atlantic Bloom Conditions Equatorial Pacific
Denitrification • Converts nitrate (NO3) Nitrite (NO2) Nitrous Oxide (N2O) Nitrogen gas (N2) • Major NO3 loss pathway in the ocean. • Anammox is another pathway to convert combined N to Nitrogen gas (NH4 + NO2 N2 + 2H2O) • Denitrification occurs under low Oxygen concentrations (e.g., sediments, soils, certain ocean regions (OMZs), etc.)
Denitrification • If none of the NO2 or N2O produced via denitrification is removed, diluted with other sources or affected by reactions other than denitrification (e.g., anammox), then the 15N/14N of the N2 produced during denitrification would equal the 15N/14N of nitrate times the KIE for NO3 reduction to NO2. (15N/14N )NO3 *NO3-NO2 = (15N/14N )NO2 *NO2-N2O (15N/14N )NO2 *NO2-N2O = (15N/14N )N2O *N2O-N2 (15N/14N )N2O *N2O-N2 = (15N/14N )N2
Culture Measurements of KIE for Denitrification Typically, the KIE for denitrification is measured by the measuring the 15N/14N trend of nitrate pool
Summary of KIE for Denitrificationin Cultures, Soils and Ocean (Granger, Limnol&Oceanogr, 2008)
Depth Profiles of NO3 deficit, d15N of NO3 and N2 in ETNP and Arabian Sea Similar depth for: - Nitrate deficit max. - d15N NO3 max. - d15N N2 min.
Estimate of KIE for Denitrification in ETNP and AS: field data •= ETNP = AS Open System: KIE = -30±3 ‰ (ETNP) and –25±5 to –28±4 ‰ (AS) Closed System: KIE = -25 ‰ (ETNP) and –22 ‰ (AS)
KIE during Nitrification in Cultures Previous lab cultures = -18 to –40 ‰ (Mariotti 1981) Field Study (Chesapeake Bay) = -13 to –16 ‰ (Horrigan et al., 1990)
Nitrogen Cycling in Sediments Ocean Water Sediments
Ocean’s Combined Nitrogen Budget Large uncertainties in the rates of N2 fixation and denitrification.
Combined N and 15N Budgets ΔN/Δt = River + Atm + Fix – Denitr – Burial Δ15N/Δt = River*(15N/14N)riv + Atm*(15N/14N)atm + Fix*(15N/14N)fix – Denitr(15N/14N)dentr – Burial*(15N/14N)orgN • Estimate three of the rates: river, atmos and burial • Estimate the 15N/14N of all the terms • Solve for N2 fixation and denitrification rates.
KIE for denitrification One significant complication is that the KIE assigned for denitrification depends significantly on the proportion of denitrification that occurs in the water column (KIE~ -20 ‰) versus in the sediments (KIE ~ -1 ‰). Thus the solution to the N and 15N budget depends on the proportion of sedimentary vs water column denitrification. Water column sediments
Combined N and 15N Budgets Results: The only way to get an isotopic balance is to have very high rates of denitrification and N2 fixation. Sedimentary Denitrification Rate = 200 - 280 Tg/yr N2 Fixation Rate = 100 - 330 Tg/yr (direct meas. << 100Tg/yr) -substantial uncertainty in budget approach.
d15N of Organic N in Ocean Sediments Correlation between changes in d15N of organic N in sediments in the Arabian Sea with ice core d18O over last few glacial cycles.
Correlation between marine d15N and atmospheric pCO2 changes Is there a link between denitrification controlling NO3 concentrations in the ocean and biological drawdown of atmospheric CO2?