Download
1 / 27
270 likes | 279 Views
Statistics Workshop Variable types, t-test & regression. Variables. Independent / Dependent AKA Explanatory / Response Continuous / Categorical. Variable types (1). Independent (explanatory) variable:

E N D
Variables • Independent / Dependent AKA • Explanatory / Response • Continuous / Categorical
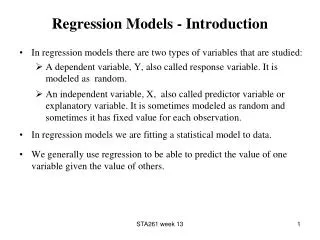
Variable types (1) • Independent (explanatory) variable: the “cause” in cause-and-effect. The value is independent of other variables • Dependent (response) variable: the “effect” in cause-and-effect. The value depends on the value of another variable • Examples: • temperature and precipitation type • depth of wheel tread and skidding distance • body size and nutrition quality • bird tail color and mating frequency
Variable types (2) • Continuous: something you measure or count; a range of values (e.g. bean length, number of leaves) • Categorical: something you assign to a discrete group (no overlap, e.g. bean type, leaf color) • Examples: • inches of rainfall • wind speed • precipitation type • dog breeds
Analyzing DataWhat type of data do you have? Regression t-test
Forming hypotheses:Depth of wheel tread and skidding distance Deeper treads make you skid less - Tread Depth - Skid distance Dependent Independent
Forming hypotheses:Depth of wheel tread and skidding distance Skidding wears down tire tread - Skid Distance - Tread Depth Dependent Independent
Testing your hypotheses:Depth of wheel tread and skidding distance • Deeper treads make you skid less Regression
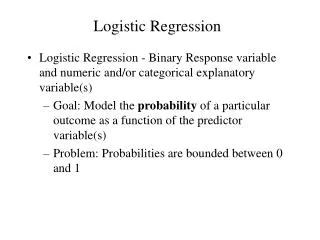
Regression • Quantifies the relationship between the variables • Tests your data against a null hypothesis • Null hypothesis: what you expect if there was no relationship between the variables • Null hypothesis: slope = 0 • Is the slope significantly different from zero? • p = 0.03: 3% chance that the relationship isn’t real, but random sampling produced this result • Deeper treads make you skid less
Forming hypotheses:Bird tail color (red vs. blue) and mating frequency Birds with red tails mate more often - Tail color - Mating frequency Dependent Independent
Forming hypotheses:Bird tail color (red vs. blue) and mating frequency • Birds with red tails mate more often t-test
t-test • Compares two categories • Do red-tailed birds or blue-tailed birds get more matings? • Calculate the mean of each group • Are the means different from each other?
t-test Birds with red tails have more matings • Null hypothesis: what you expect if category doesn’t have an affect (tail color doesn’t affect mating success) • Null hypothesis: no difference between the means • p = 0.18, 18% chance the difference isn’t real, but produced by random sampling p = 0.18
Testing hypotheses Deeper treads make you skid less Birds with red tails get more mating chances p = 0.03 p = 0.18 Regression t-test
0.05 cut-off for statistical significance • If p < 0.05, we can say that our results are “statistically significant” • Otherwise, the probability of our results being not due to random chance is too large and our results are NOT “statistically significant”
What are the variables? Are they categorical or continuous? Form a hypothesis about how the variables could be related (which is dependent, which is independent, why?). Draw a graph of your predicted results. Would you use a t-test or regression to test this? Case studies
Climate scientists have noticed that the polar ice caps are melting more in the summers and refreezing less in the winters. There are also indications that extreme weather events (tornadoes, heat waves) are becoming more common.
Productivity is one of the most important metrics in agriculture – how much of something can you grow on a piece of land? Ecologists are interested in whether diversity impacts productivity. Some agricultural innovators are interested in trying to grow multiple kinds of crops together. How might these ideas influence each other?
As you climb a mountain, the plants get shorter and shorter. Scientists interested in whether this was due to genetics or environment have taken plants from high and low elevation and grown them together in each environment.
Evolutionary biologists predict that an individual is more likely to give another costly help (altruism) the more closely related they are. Ornithologists have tested this by putting baby birds in nests with siblings or unrelated nestlings and measuring how loudly they call (louder nestlings are more likely to be fed than their neighbors).
A single unlucky moose may host over 100,000 moose ticks. They rub their fur off in an effort to get rid of ticks. How would you test whether the amount of fur left on a moose is a predictor of their tick load?
Many critters living in the water are eaten by both fish and insects. Fish predators are often gape–limited (they can only eat something up to a certain size). What do you think you would find if you compared growth rates in prey from ponds with and without fish?
Forming hypotheses:Depth of wheel tread and skidding distance 1) Deeper treads make you skid less 2) More skidding makes your treads shallower
Forming hypotheses:Depth of wheel tread and skidding distance 1) Deeper treads make you skid less 2) More skidding makes your treads shallower