Download
1 / 8
80 likes | 334 Views
Region TAXI City laptops, PDAs Campus In-Building Figure 1 100 USA market 90 80 70 cellular + PCS subs Internet users 60 millions 50 paging subs 40 30 dedicated wireless laptop users data subs 20 10 annual laptop sales 0 1995 2000 Figure 2 LOCAL AREA PACKET SWITCHING

E N D
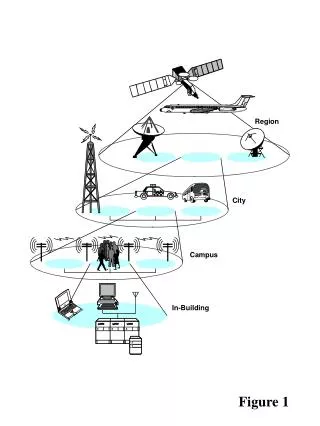
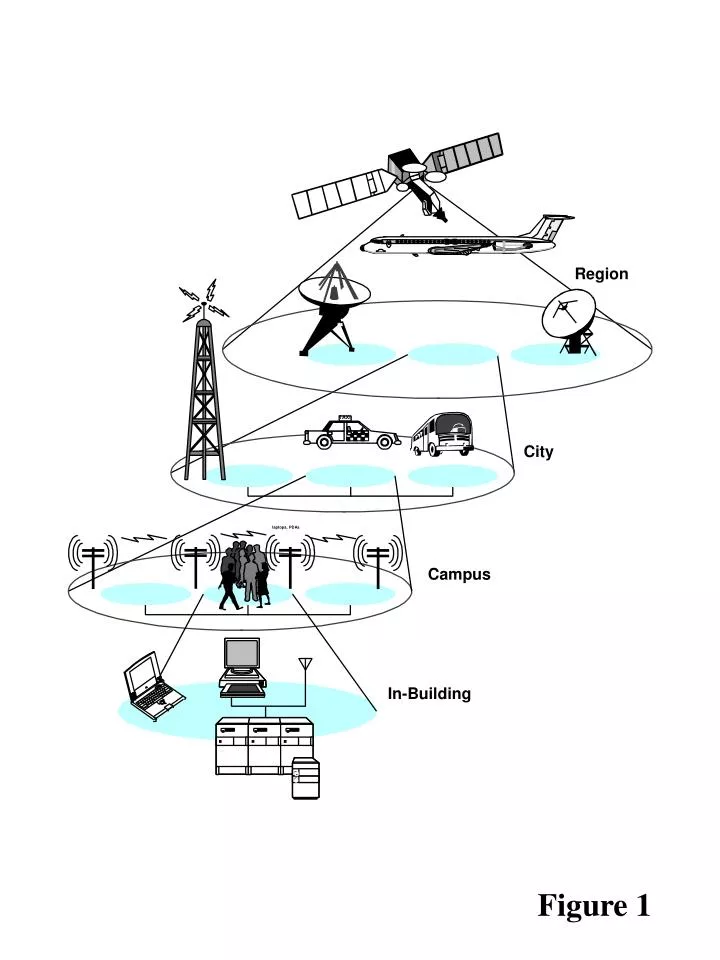
Region TAXI City laptops, PDAs Campus In-Building Figure 1
100 USA market 90 80 70 cellular + PCS subs Internet users 60 millions 50 paging subs 40 30 dedicated wireless laptop users data subs 20 10 annual laptop sales 0 1995 2000 Figure 2
LOCAL AREA PACKET SWITCHING WIDE AREA CIRCUIT SWITCHING ATM ATM 100 M 100,000 100,000 Ethernet 10,000 10,000 FDDI wired- wireless bit-rate "gap" Ethernet wired- wireless User User 1000 1000 bit-rate "gap" ISDN Bit-Rate Bit-Rate 2nd gen WLAN (kbps) (kbps) 100 100 28.8 modem 1st gen WLAN 32 kbps Polling 9.6 modem PCS 14.4 digital cellular 10 10 9.6 cellular 2.4 modem Packet 2.4 cellular 1 1 Radio .1 .1 .01 .01 1970 1980 1990 2000 1970 1980 1990 2000 YEAR YEAR Figure 3
10 0 dB With Respect -10 to RMS Value -20 -30 0.5l 0 0.5 1 1.5 t, in seconds 0 10 20 30 x, in wavelength Figure 5
Received Signal Power (dB) path loss shadow fading Rayleigh fading log (distance) Figure 6
Hierarchical Star Peer-to-Peer Figure 7
BASE STATION Figure 8