Download
1 / 78
780 likes | 932 Views
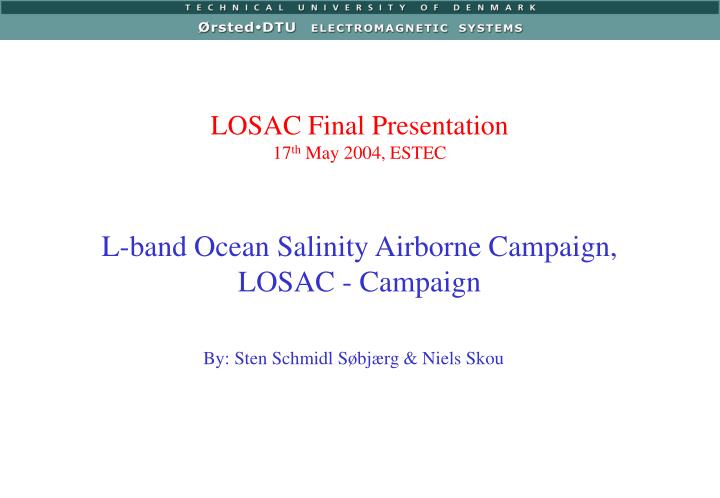
L-band Ocean Salinity Airborne Campaign, LOSAC - Campaign. LOSAC Final Presentation 17 th May 2004, ESTEC. By: Sten Schmidl Søbjærg & Niels Skou. Outline. LOSAC Background The EMIRAD Correlation Radiometer Radiometer Linearity/Stability The Aircraft Installation

E N D
L-band Ocean Salinity Airborne Campaign, LOSAC - Campaign LOSAC Final Presentation17th May 2004, ESTEC By: Sten Schmidl Søbjærg & Niels Skou
Outline • LOSAC Background • The EMIRAD Correlation Radiometer • Radiometer Linearity/Stability • The Aircraft Installation • The Radiometric Calibration Schedule • The LOSAC flights
LOSAC Background • TB / S = 1 K / psu (practical salinity unit) • To find S to 0.1 psu level require T = 0.1 K and perfect knowledge of other contributers! • TB / SST = -0.2 K / °C in warm ocean (less in cold) • Well modeled and SST measured by other sensors • Sensitivity to wind speed and wind direction not well known! • Azimuthal variation unknown! • No polarimetric measurements!=> New measurements needed for understanding of SMOS data!
The brightness Stokes vector : is the wavelength k: is Boltzmanns constant z: is the impedance of the medium in which the wave propagates EV E45 EL EH ER E-45
The EMIRAD L-band Radiometer • Advantages: • Less analog components (i.e. less weight, size) • Flexibility for reconfiguration • Disadvantages: • In radiometer sense an unknown principle • System gain at RF-level
Radiometer Linearity, EMIRAD Sky 7 K • Attenuation from 1 to 30 dB Input TBrightness from 50 K to 300 K • Measurements with/without noise contribution (TN < 130K) • Transfer function calculated Variable Attenuation 1 dB - 30 dB Noise Diode 0 K to 130 K Radiometer Box Radiometer Output [counts] Radiometer Gain [counts/K] Input Brightness Temperature [K] Input Brightness Temperature [K]
Radiometer Stability, EMIRAD • Measurement: 1½ hour (every 8 msec.) • TEnvironment +4 °C (5 °C to 9 °C)applied after 45 minutes. • Input Brightness Temperature = 42 °C( TInput +0.1 °C) • 0.4 K (TV and TH) • 0.2 K (U and V) Input Temperature [° C]
EMIRAD Stability, Galactic Background, 040121 Galactic Background, 21st of January 2004
EMIRAD Stability, Galactic Background, 040122 Galactic Background, 22nd of January 2004
EMIRAD Aircraft Installation The EMIRAD radiometer in the stored position during take-off, transit, and landing The EMIRAD radiometer in the measurement position in the C-130 aircraft
EMIRAD L-band Polarimetric Radiometer • Polarimetrc radiometer => measures all 4 Stokes parameters! • Correlation radiometer with direct sampling • Frequency: 1.4 GHz (1403 - 1424 MHz) • Sideband rejection: -25 dB @ 1400 MHz and 1427 MHz -60 dB @ 1395 MHz and 1432 MHz • A/D is 8-bit with 63.5 MHz sampling • Integration: Programmable from 8 msec • Sensitivity: 0.1 K (for 1 sec. integration) • Stability: about 0.1 K over 15 min in normal operation conditions • Calibration targets: Internal load and noise diode • 15° antenna beam (90 x 90 cm square horn, 200 cm length) • Side-looking horn, 23° or 40° depression • Footprint: 400x500 m from 1000 m altitude
EMIRAD In-flight Calibration Schemes t Antenna+Noise Antenna Internal Load+Noise Internal Load Calibration scheme used for circle flights. No loss of data within the circle. t Antenna+Noise Antenna Internal Load+Noise Internal Load Calibration scheme used for level flights.
EMIRAD In-flight Calibration and Drift t Antenna+Noise Antenna Internal Load+Noise Internal Load Radiometer drift in detection and correlation channels during data takes. The tables show the difference in radiometer output from the first to the last calibration sequence at different track lengths.
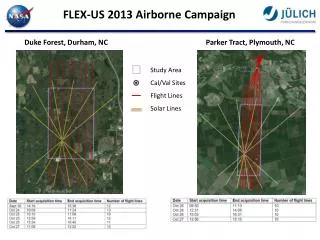
The LOSAC Flights Flight position Meteorological station: Wind speed Wind direction Sea Surface Temp. Sea Surface Salinity
The LOSAC Flights (1) Flight Tracks Flight Track Observed Track Level flights with roll angle 0(equal to an incidence angle of 50) Each leg has a minimum duration of 2 minutes Circle flights with roll angles from 5 to 45 (equal to incidence angles from 22 to 62 ) Each circle repeated 3-16 times
The LOSAC Flights (2) • 16th January 2001 - technical test flight North Sea (55.68N, 4.70E) Circle patterns No data due to RF interference! • 15th March 2001 North Sea (55.68N, 4.70E) Circle patterns • 23rd March 2001 Kattegat (57.04N, 11.07E) Circle patterns • 25th October 2001 North Sea (55.68N, 4.70E) Circle patterns Wing wags, Nose wags • 6th March 2003 Atlantic Ocean (61.51°N, 1.27°E) Circle patterns Level flights Wing wags, Nose wags • 20th October 2003, Target A North Sea (55.68N, 4.70E) Circle patterns Level flights Wing wags, Nose wags • 20th October 2003, Target BNorth Sea (57.86N, 5.47E) Circle patterns
The LOSAC Flight, 15th March 2001 Position: North Sea (55.68N, 4.70E) Time: 19:20 UTC - 20:20 UTC Aircraft: C-130, id: B-678 Updated recently with new auto pilot. Can maintain stabile attitude within ±0.5 for roll < 32.0 Flight Altitude: 1000 m Flight Pattern: Circle flights 52 incidence angle (3 circles) 42 incidence angle (3 circles) 35 incidence angle (3 circles) 22 incidence angle (3 circles)INU: OKGPS: NoRTP: No Meteorological station at oil rigs out of order => Ground truth data from Hvide Sande at the Danish west coast. Wind Speed: 3.6 m/sec. Wind Direction: 300Weather: Partly clouded
The LOSAC Flight, 23rd March 2001 Position: Kattegat (57.04N, 11.07E) Time: 19:00 UTC - 20:10 UTC Aircraft: C-130, id: B-680 No updated auto pilot and navigation instruments. Manual control during data acquisition. Flight Altitude: 1000 m Flight Pattern: Circle flights 62 incidence angle (3 circles) 57 incidence angle (3 circles) 47 incidence angle (3 circles) 37 incidence angle (3 circles) 25 incidence angle (2 circles) INU: OKGPS: No RTP No Icing conditions over North Sea site => flight impossible in the area Meteorological stations only available on land at the Danish east coast and on the island Anholt. Wind Speed: 5.1 m/sec. Wind Direction: 140Weather: Clouded
The LOSAC Flight, 25th October 2001 Position: North Sea (55.68N, 4.70E) Time: 17:10 UTC - 18:45 UTC Aircraft: C-130, id: B-679 New auto pilot. Attitude within ±0.5 for roll < 32.0 Flight Pattern: Circle flights (2000 m altitude) 55 incidence angle (3 circles) 45 incidence angle (3 circles) 35 incidence angle (3 circles) 27 incidence angle (3 circles) Flight Pattern: Circle flights (45 incidence angle) 1000 m flight altitude (3 circles) 2000 m flight altitude (3 circles) 3000 m flight altitude (3 circles) Flight Pattern: ±45 Wing Wags, ±5 Nose Wags INU: OKGPS: Yes - Some problems with receiverRTP: No Meteorological station at oil rigs. Wind Speed: 11.0 m/sec. Wind Direction: 190 Sea Temperature: 13.4 C Wave Height: 1.2 m Weather: Almost clear Sky
The LOSAC Flight, 6th March 2003 Position: Atlantic Ocean (61.51N, 1.27E) Time: 18:20 UTC - 20:50 UTC Aircraft: C-130, id: B-678 New auto pilot. Attitude within ±0.5 for roll < 32.0 Flight Pattern: Circle flights (2000 m altitude) 45 incidence angle (13 circles) 35 incidence angle (16 circles)Flight Pattern: Level flights (50 incidence angle) 2 minutes legs (8 legs)Flight Pattern: ±45 Wing Wags ±5 Nose Wags INU: OKGPS: OK RTP: Yes - Minor problems with processor Meteorological data from the Danish Meteorological Institute, DMI. Data interpolated between the Faeroe Islands and Norway Wind Speed: 20.0 m/sec. Wind Direction: 0 Weather: Clouded
The LOSAC Flight, 20th October 2003, Target A Position: North Sea (55.68N, 4.70E) Time: 18:30 UTC - 20:20 UTC Aircraft: C-130, id: B-678 New auto pilot. Attitude within ±0.5 for roll < 32.0 Flight Pattern: Circle flights (1750 m altitude) 45 incidence angle (16 circles) 35 incidence angle (16 circles)Flight Pattern: Level flights (50 incidence angle) 2 minutes legs (8 legs)Flight Pattern: ±45 Wing Wags ±5 Nose Wags INU: OKGPS: OK RTP: OK Meteorological station at oil rigs. Wind Speed: 9.8 m/sec. Wind Direction: 40 Weather: Clouded
The LOSAC Flight, 20th October 2003, Target B Position: North Sea (57.86N, 5.47E) Time: 17:10 UTC - 17:45 UTC Aircraft: C-130, id: B-678 New auto pilot. Attitude within ±0.5 for roll < 32.0 Flight Pattern: Circle flights (1750 m altitude) 45 incidence angle (16 circles)INU: OKGPS: OK RTP: OK Meteorological data from the Danish Meteorological Institute, DMI. Data interpolated between several stations. Wind Speed: 0 - 1 m/sec. Wind Direction: changing Weather: Clouded In the center of a low pressure, causing very low instantaneous wind speed.
Preliminary Conclusions (1) • L-band radiometer built and tested • Long duration measurements indicate good stability • Calibration sequence before and after each data take indicate good stability • Radiometer linearity verified and transfer function calculated • Technical test flight carried out - RF interference identified. • Circle flights carried out over 6 test sites at wind speeds from 3 m/sec. to 20 m/sec. • Circle flights done with incidence angles from 22 to 62 at constant flight altitude • Circle flights done at flight altitudes from 1000 m to 3000 m with constant incidence • Level flights (cloverleaf with 8 legs) performed over two targets • Wing wags and nose wags done for validation of motion compensation • Meteorological data obtained for the 6 scenes
L-band Ocean Salinity Airborne Campaign, LOSAC - Results LOSAC Final Presentation17th May 2004, ESTEC By: Sten Schmidl Søbjærg & Niels Skou
Outline • Summary of LOSAC Campaign • Aircraft Motion Compensation • Wing Wags and Nose Wags • Results from Circle Flights • Averaging Methods • Changing Flight Altitude • Averaging of Circles • Level Flights • Harmonic Analysis of Azimuth Signatures • Conclusions and Perspectives
Preliminary Conclusions (1) • L-band radiometer built and tested • Long duration measurements indicate good stability • Calibration sequence before and after each data take indicate good stability • Radiometer linearity verified and transfer function calculated • Technical test flight carried out - RF interference identified. • Circle flights carried out over 6 test sites at wind speeds from 3 m/sec. to 20 m/sec. • Circle flights done with incidence angles from 22 to 62 at constant flight altitude • Circle flights done at flight altitudes from 1000 m to 3000 m with constant incidence • Level flights (cloverleaf with 8 legs) performed over two targets • Wing wags and nose wags done for validation of motion compensation • Meteorological data obtained for the 6 scenes
Polarization Mixing due to Aircraft Attitude (1) The Stokes vector in the ideal situation Antenna rotation => Polarization mixing E’V EV E45 EH E’H Measured Stokes vector with antenna rotation E-45
Polarization Mixing due to Aircraft Attitude (2) Errors in the 2nd (Q) and 3rd (U) Stokes parameters at typical values, Q=50 K, U=1 K, and rotation () ranging from -2 to 2 . At = -0.5 : Q = 0.025K, U = 0.872K At = 0.5 : Q = 0.010K, U = -0.873 K
Sea Surface Brightness Temperatures Horizontal and vertical brightness temperatures as function of the actual incidence angle. 2nd Stokes parameter, Q, strongly influenced - up to 4K/degree!
Rotation, Incidence Angle, and Aircraft Attitude Antenna rotation, , determined by aircraft pitch, Incidence angle, , determined by aircraft pitch, , aircraft roll, , and antenna depression, d Incidence angle, , for small values of aircraft pitch Antenna look direction, , determined by aircraft heading, hdg, aircraft pitch, , aircraft roll, , and antenna depression, d
Aircraft Attitude and Flight Tracks - Typical A typical example of aircraft attitude during a flight track. The aircraft drifts with the wind during data acquisition in order to keep roll as stabile as possible.
Roll Dependence, 2nd Stokes Parameter Raw 2nd Stokes parameter as a function of the aircraft roll. (45 incidence angle, 2000m flight altitude) Raw 2nd Stokes parameter and aircraft roll. (45 incidence angle, 2000m flight altitude)
Pitch Dependence, 3rd Stokes Parameter Raw 3rd Stokes parameter as afunction of the aircraft pitch. (45 incidence angle, 2000m flight altitude) Raw 3rd Stokes parameter and aircraft pitch. (45 incidence angle, 2000m flight altitude)
Wing Wags, ±45° Roll Aircraft attitude during the ±45° roll experiment. Attitude versus Time-of-Day. Red curves: Measured Vertical and Horizontal brightness temperature as function of the incidence angle. Green/Blue curves: Modeled Vertical and Horizontal brightness temperature as function of the incidence angle.
Wing Wags, ±45° Roll, Raw Data Raw Modified Stokes parameters for the ±45° roll experiment.
Wing Wags, ±45° Roll, Corrected Data Corrected Modified Stokes parameters for the ±45° roll experiment.
Wing Wags, ±45° Roll, Corrected Aircraft attitude during the ±45° roll experiment. Red curves: Corrected Vertical and Horizontal brightness temperature as function of the incidence angle. Green/Blue curves: Modeled Vertical and Horizontal brightness temperature as function of the incidence angle.
Nose Wags, ±5° Pitch Aircraft attitude during the ±5° pitch experiment. Measured 3rd Stokes Parameter as function of the actual aircraft pitch. The observed offset is due to an eventual misalignment between the antenna system and the INU, mounted on the aircraft floor.
Nose Wags, ±5° Pitch, Raw Data Raw Stokes parameters for the ±5° pitch experiment.
Nose Wags, ±5° Pitch, Corrected Data Corrected Stokes parameters for the ±5° pitch experiment.
Preliminary Conclusions (2) Corrections, roll variations: (1) Klein-Swift Model + Camps Model used for deviation calculation. Variations: dt/d < 0.08 K/ (2) 0 to 45 degrees roll measured and low-pass filtered => Model for deviation calculation. Variations: dt/d < 0.08 K/ (3) Simple linear regression. Variations: dt/d < 0.23 K/ (4) Combination of (1) and (3) Variations: dt/d < 0.23 K/ (5) Combination of (2) and (3) Variations: dt/d < 0.08 K/ Correction, pitch variations: (1) Theoretical model for polarization mixing Variations: dt/d < 0.15 K/ (2) Simple linear regression Variations: dt/d < 1.00 K/ !! (3) Combination of (1) and (2) Variations: dt/d < 0.15 K/
Corrected Data, 25° Incidence, 25th October 2001 Modified Stokes parameters aligned to aircraft heading. (25 incidence angle, 2000m flight altitude)
Raw Data, 35° Incidence, 25th October 2001 Modified Stokes parameters aligned to aircraft heading. (35 incidence angle, 2000m flight altitude)
Raw Data, 45° Incidence, 25th October 2001 Modified Stokes parameters aligned to aircraft heading. (45 incidence angle, 2000m flight altitude)
Raw Data, 55° Incidence, 25th October 2001 (1) Modified Stokes parameters aligned to aircraft heading. (55 incidence angle, 2000m flight altitude, 1st circle)
Raw Data, 55° Incidence, 25th October 2001 (2) Modified Stokes parameters aligned to aircraft heading. (55 incidence angle, 2000m flight altitude, 2nd circle)
Raw Data, 55° Incidence, 25th October 2001 (3) Modified Stokes parameters aligned to aircraft heading. (55 incidence angle, 2000m flight altitude, 3rd circle)
Preliminary Conclusions (3) • Noise signatures, larger than 1 K, present in all circles. • Noise signatures seem to be constant in time, rather than azimuth • Integration may reduce the amount of noise • Spatial integration => larger antenna footprint • Temporal integration => Integration of several circles+Short time between measurement of different azimuth directions- Takes long time to obtain many circles • Temporal integration => Level flights+Very good integration- Few samples of azimuth signature- Long time between recording of each direction => risk of drifts / change of target