Download
1 / 15
0 likes | 10 Views
Know the 7 best Bollinger Bands trading strategies in a simple way that works in every scenario and know Bollinger Bands Best Setting.<br>

E N D
Best Bollinger Bands Trading Strategy You Should Learn -StockDaddy
Do you ever feel puzzled when you see those three lines on the screen showing the price range of the stocks you're interested in? Do you want to know what they can reveal about the market situation?
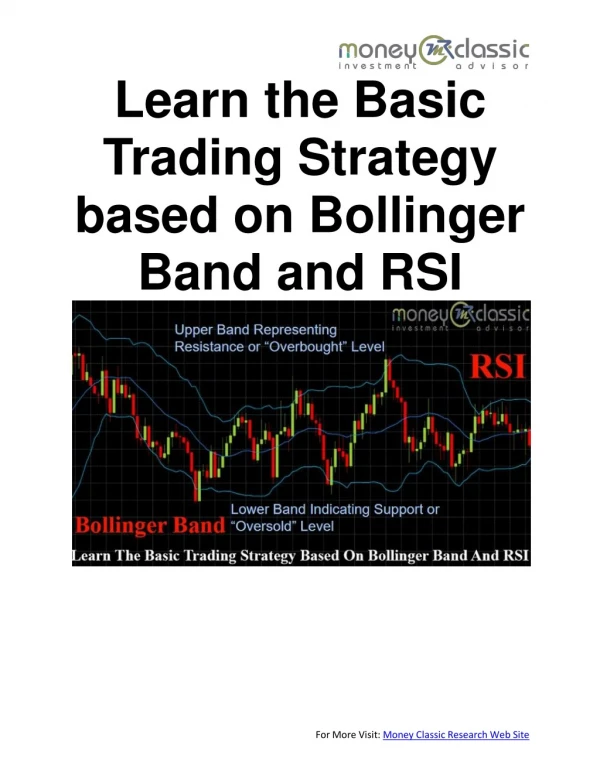
Idea behind the Bollinger band. That three-lined indicator you see is known as the Bollinger band. The Bollinger Band is like a tool that helps us understand how much the prices of financial things go up and down. Imagine it like three lines put together, and these lines are also called bands The middle line shows the regular average of the price (for 20 days, usually). The other two lines, the top line and the bottom line, are kind of like a bit higher and lower than the middle line. They show how much the price usually goes up and down, kind of like a measure. This measure is called standard deviation (normally 2). This standard deviation shows the difference between those two lines – the high one and the low one. If the space between those lines is small, it means that the prices aren't changing a lot – they're not going up and down much. When the space gets bigger, it's like the prices are jumping around more. So, when these three lines work together, they can show us if the prices are kind of high or low compared to usual.
Best Bollinger Bands Trading Strategy • Bollinger Squeeze • RSI Strategy • Reversal Strategy • Trade Within the Bands • Moving Average Strategy • MACD Strategy • Price Action Strategy Learn to use these strategy with best stock market courses
1). Bollinger Squeeze • This happens when the lines get closer to each other. It's like a rubber band being pressed. This tells us that the prices might suddenly go up a lot or down a lot. • After the lines stop being squished, the prices might go up or down – we don't know which one. If they go up, it's good news for buying. If they go down, it's not so good – that's selling. But remember, the squished lines alone don't tell us to buy or sell. They just give a hint that something might happen. Know how to use Bollinger Bands Trading Strategy
2). RSI Strategy • The Bollinger band has a small problem – it doesn't tell us how strongly the prices are moving. • That's where the RSI comes in. It's like another friend. This friend checks if the prices are going up more times than they're going down, or the other way around. It's like counting. RSI goes from 0 to 100. If it's above 70, that means the prices are going up too much and might come down. If it's below 30, it's like the prices went down too much and might go up soon. • When the prices seem to go higher but the RSI says they're not really strong, that's a sign of weakness. It's like saying, "Hey, something's not right." On the flip side, when the prices look lower but the RSI says, "No, they're kinda strong," that's a sign of strength. It's like a thumbs-up.
3). Reversal Strategy • Imagine the Bollinger bands as rubber bands. They usually keep the prices in between. But sometimes, they stretch too far and then come back to the middle. This can show us that the prices might go the other way around soon. • But, to know for sure, we need help from other things like support and resistance (kind of like helpers) and the shapes of the candlesticks (they're like signs).
4). Trade the Bands • When the prices went really high or really low, the Bollinger bands don't stretch much. They're like resting. And when they're resting, the prices might just go up a bit and down a bit, like playing. • If the bands are going straight, the prices are like to stay inside. So, when there's no clear direction, it's clever to buy when the price is near the bottom and sell when it's near the top. This works better when the prices are just moving around without deciding where to go.
5). Moving Average Strategy • Here's an easy one. When the price goes above the middle line (which is like an average), it might be time to buy because things are getting better. If the price goes below that line, maybe it's time to say goodbye and sell. • You can look at different stocks all at once with the following Chart Layout. It's like having many TVs showing different shows but for stocks.
6). MACD Strategy • Just like a good chef uses different ingredients to make a delicious dish, traders use different tools to make smart decisions. Bollinger Bands are one of those tools. But they work even better when you use them with something called the Moving Average Convergence Divergence (MACD) indicator. • Think of the MACD indicator as a sidekick to Bollinger Bands. When they work together, they can give even better hints about when to make a trade. The MACD indicator helps you know when the prices might change by looking at how some lines cross each other.
7). Price Action Strategy • The Price Action strategy helps traders spot when the prices are about to do something special. • First, you look at the Bollinger Bands and see if the prices are close to the lines or far away. Then, you use the Price Action strategy to spot something called a "signal." This is like a sign that says, "Hey, get ready, something interesting might happen!" • One popular signal is when the price touches the edge of the Bollinger Bands. It's like a little ping telling you to pay attention. And when you see another special pattern in the price chart, like the "morning star" pattern, it's another hint that the prices might change soon. Learn to use price action trading strategy withadvance price action trading course
FAQ Que 1. What are Bollinger Bands? Ans: Bollinger Bands are a technical analysis tool designed by John Bollinger in 1983. They consist of three lines that show the price range of financial assets. The middle line represents the average price, while the upper and lower lines indicate price volatility. Que 2. How do Bollinger Bands work? Ans: Bollinger Bands help traders understand price movement. The middle line is the average price (usually over 20 days), while the upper and lower lines show price volatility based on standard deviation. When the space between the lines is small, prices are stable; when it's larger, prices are more volatile.
Que 3. What is the Bollinger Squeeze? Ans: The Bollinger Squeeze occurs when the bands converge, indicating low volatility. This could lead to a significant price move, either up or down, once the bands expand again. Que 4. Can Bollinger Bands predict price movements with certainty? Ans: Bollinger Bands provide insights into potential price movements based on historical data and volatility, but they don't guarantee specific outcomes. Traders should use them in conjunction with other indicators and analysis methods. Que 5. How can I use Bollinger Bands effectively? Ans: To use Bollinger Bands effectively, understand your trading style and goals. Experiment with different settings and combine them with other indicators to develop a comprehensive trading strategy.
Que 6. Are Bollinger Bands foolproof trading tools? Ans: Bollinger Bands are valuable tools, but like any indicator, they have limitations. They work best when used alongside other indicators and thorough analysis. Que 7. Is Bollinger Bands trading suitable for beginners? Ans: Bollinger Bands can be used by traders of all experience levels. However, beginners should take time to understand the indicator, practice with demo accounts, and consider seeking guidance from experienced traders. Que 8. Where can I find more information on Bollinger Bands and trading strategies? Ans: You can find more information on Bollinger Bands and trading strategies in websites such as ours - StockDaddy, trading forums, books on technical analysis, and educational platforms dedicated to trading. Remember to verify information from reliable sources.
The Complete Stock Learning Platform Learn Stock Market Trading and Investing With StockDaddy Thank You Website: https://www.stockdaddy.in