Download
1 / 1
10 likes | 123 Views
Analyzing Brightness Variations of an SX Phoenicis Star, XX Cyg Shouvik Bhattacharya Student Academic Conference 2013 | Department of Physics & Astronomy | Minnesota State University Moorhead | MN 56563.

E N D
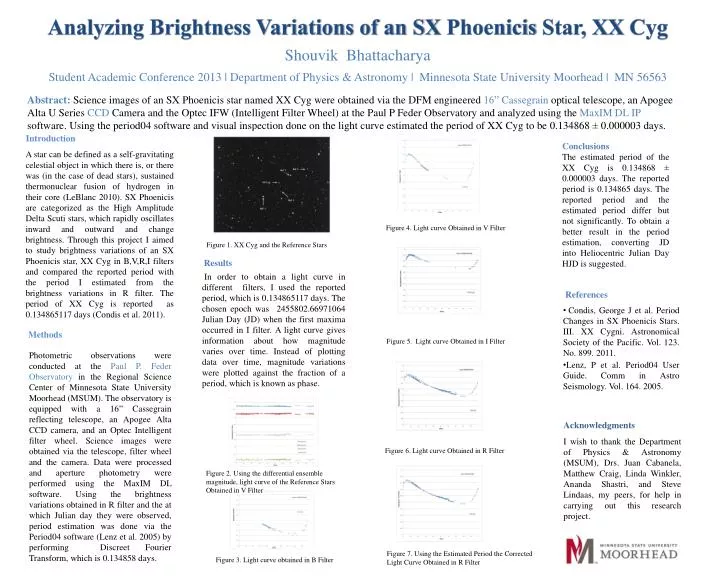
Analyzing Brightness Variations of an SX Phoenicis Star, XX Cyg Shouvik Bhattacharya Student Academic Conference 2013 | Department of Physics & Astronomy | Minnesota State University Moorhead | MN 56563 Abstract: Science images of an SX Phoenicis star named XX Cyg were obtained via the DFM engineered 16” Cassegrainoptical telescope, an Apogee Alta U Series CCD Camera and the Optec IFW (Intelligent Filter Wheel) at the Paul P Feder Observatory and analyzed using the MaxIM DL IP software. Using the period04 software and visual inspection done on the light curve estimated the period of XX Cyg to be 0.134868 ± 0.000003 days. Introduction Conclusions The estimated period of the XX Cyg is 0.134868 ± 0.000003 days. The reported period is 0.134865 days. The reported period and the estimated period differ but not significantly. To obtain a better result in the period estimation, converting JD into Heliocentric Julian Day HJD is suggested. A star can be defined as a self-gravitating celestial object in which there is, or there was (in the case of dead stars), sustained thermonuclear fusion of hydrogen in their core (LeBlanc 2010). SX Phoenicis are categorized as the High Amplitude Delta Scuti stars, which rapidly oscillates inward and outward and change brightness. Through this project I aimed to study brightness variations of an SX Phoenicis star, XX Cyg in B,V,R,I filters and compared the reported period with the period I estimated from the brightness variations in R filter. The period of XX Cyg is reported as 0.134865117 days (Condis et al. 2011). Figure 4. Light curve Obtained in V Filter Figure 1. XX Cyg and the Reference Stars Results In order to obtain a light curve in different filters, I used the reported period, which is 0.134865117 days. The chosen epoch was 2455802.66971064 Julian Day (JD) when the first maxima occurred in I filter. A light curve gives information about how magnitude varies over time. Instead of plotting data over time, magnitude variations were plotted against the fraction of a period, which is known as phase. • References • Condis, George J et al. Period Changes in SX Phoenicis Stars. III. XX Cygni. Astronomical Society of the Pacific. Vol. 123. No. 899. 2011. • Lenz, P et al. Period04 User Guide. Comm in Astro Seismology. Vol. 164. 2005. Methods Figure 5. Light curve Obtained in I Filter Photometric observations were conducted at the Paul P. Feder Observatory in the Regional Science Center of Minnesota State University Moorhead (MSUM). The observatory is equipped with a 16” Cassegrain reflecting telescope, an Apogee Alta CCD camera, and an Optec Intelligent filter wheel. Science images were obtained via the telescope, filter wheel and the camera. Data were processed and aperture photometry were performed using the MaxIM DL software. Using the brightness variations obtained in R filter and the at which Julian day they were observed, period estimation was done via the Period04 software (Lenz et al. 2005) by performing Discreet Fourier Transform, which is 0.134858 days. • Acknowledgments • I wish to thank the Department of Physics & Astronomy (MSUM), Drs. Juan Cabanela, Matthew Craig, Linda Winkler, AnandaShastri, and Steve Lindaas, my peers, for help in carrying out this research project. Figure 6. Light curve Obtained in R Filter Figure 2. Using the differential ensemble magnitude, light curve of the Reference Stars Obtained in V Filter Figure 7. Using the Estimated Period the Corrected Light Curve Obtained in R Filter Figure 3. Light curve obtained in B Filter