Understanding Internal Boundary Layer Dynamics: Thermal and Mechanical Influences on Wind Profiles
130 likes | 265 Views
This study explores the internal boundary layer (IBL) dynamics, focusing on thermal and mechanical effects induced by air advection across surface discontinuities in temperature and roughness. Utilizing a large eddy simulation (LES) model, we analyze the wind profiles influenced by homogeneous and inhomogeneous surface conditions. Key outcomes highlight the variation in mean wind and momentum flux, emphasizing the importance of surface roughness and pressure gradients in altering flow characteristics. This research has significant implications for understanding coastal aerodynamics and related environmental phenomena.

Understanding Internal Boundary Layer Dynamics: Thermal and Mechanical Influences on Wind Profiles
E N D
Presentation Transcript
Xin Xi Feb. 28
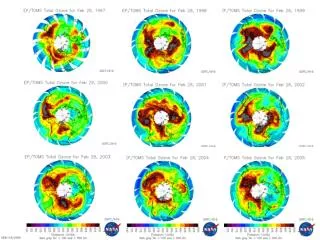
Background IBL (internal boundary layer): A layer bounded below by the surface and up by a discontinuity in certain atmospheric properties; associated with horizontal advection of air across a discontinuity in some property of the surface, e.g., heat flux and aerodynamic surface roughness. Thermal IBL: caused by horizontal air advection across a discontinuity in surface temperature; is important in coastal areas (growing in depth and merging with CBL). Mechanical IBL: caused by horizontal air advection across a discontinuity of surface roughness; it grows to include the whole surface layer when the surface becomes more rough.
LES model The LES model used in this study solves the following equations: • It’s assumed neutral stratification (the turbulent flow is driven by a geostrophic wind). • The domain: 9600m*1800m*900m • Spatial resolution: two-grid architecture with an outer grid of 320*60*60 points and inner fine grid of 960*180*60 points, to solve the subgrid flow structures. • Surface roughness: z0=0.16 m for smooth surface and z0=0.83m for rough surface • Scenarios: homogeneous case (z0=0.16 and z0=0.83, respectively) and inhomogeneous case with z0=0.16 for o<x<4800m and z0=0.83 for 4800m<x<9600m • Model spin-up time (quasi-equilibrium state): 11 hours
Results Mean wind profile • Roughness induced change in mean wind is larger for homogeneous surface. • For inhomogeneous surface, locally induced pressure gradient decelerates/ accelerate the flow over smooth/rough surfaces. linear scale logarithmic scale
To reach the logarithmic wind profile, For smooth surface, k>0.4 at xf=400m and k=0.4 at large fetches. For rough surface, k=0.37 at large fetches. For homogeneous surface, k=0.4 at zo=0.16m and k=0.385 zo=0.83m. Variation in von karman constant in inhomogeneous surface is larger, due to locally induced pressure gradients, which can affect k in large downwind distance. Normalized mean wind
IBL height: where the difference in mean flux from its upwind value at fetch xf=-1600m is 10%. • The difference of these formulations is their approximation of velocity distribution. • The IBL height is controlled by the rougher surface, locally or through advection of the turbulent eddies produced over rougher regions.
w z0=0.16m z0=0.16m q z0=0.83m z0=0.83m smooth VS rough surface inhomogeneous VS homogeneous surface momentum flux Quadrant components
Occurrence frequency of 34% and 31% for ejection and sweep events
To study the transport of momentum flux, the budget equation is used: Mean wind advection Shear production term Turbulent transport Pressure-velocity interaction term (pressure destruction) Viscosity and buoyancy are neglected.
Momentum flux decreases over smooth surface and increase over rough surface. Advection and shear production terms
Shear production Pressure destruction advection Turbulent transport Vertical profile of momentum flux budget equation terms
A, B sweep C ejection A, C: Vortical structures produce strong ejection and sweep when stretched by wind shear. Pressure destruction
Pressure destruction Strong ejection Counter-rotating motions associated with ejection