Download
1 / 18
180 likes | 304 Views
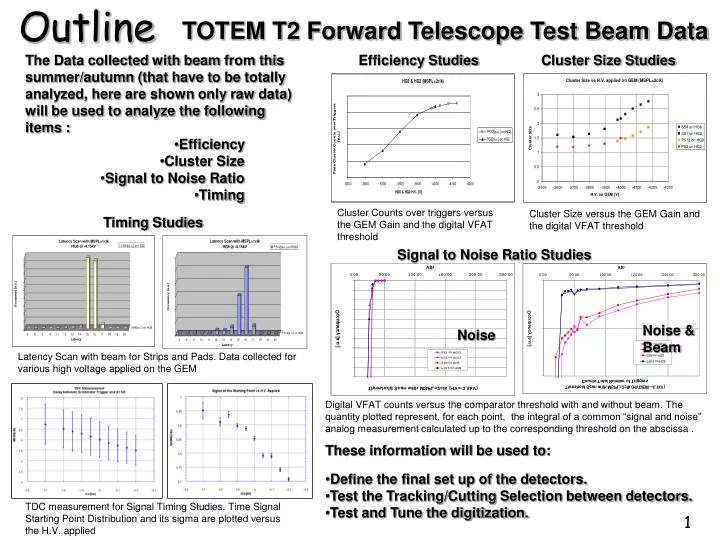
TOTEM T2 Forward Telescope Test Beam Data. The Data collected with beam from this summer/autumn (that have to be totally analyzed, here are shown only raw data) will be used to analyze the following items :. Outline. Efficiency Studies. Cluster Size Studies. Efficiency Cluster Size

E N D
TOTEM T2 Forward Telescope Test Beam Data The Data collected with beam from this summer/autumn (that have to be totally analyzed, here are shown only raw data) will be used to analyze the following items : Outline Efficiency Studies Cluster Size Studies • Efficiency • Cluster Size • Signal to Noise Ratio • Timing Cluster Counts over triggers versus the GEM Gain and the digital VFAT threshold Cluster Size versus the GEM Gain and the digital VFAT threshold Timing Studies Signal to Noise Ratio Studies Noise & Beam Noise Latency Scan with beam for Strips and Pads. Data collected for various high voltage applied on the GEM Digital VFAT counts versus the comparator threshold with and without beam. The quantity plotted represent, for each point, the integral of a common “signal and noise” analog measurement calculated up to the corresponding threshold on the abscissa . • These information will be used to: • Define the final set up of the detectors. • Test the Tracking/Cutting Selection between detectors. • Test and Tune the digitization. TDC measurement for Signal Timing Studies. Time Signal Starting Point Distribution and its sigma are plotted versus the H.V. applied 1
Latency Scan @ -4kV & with MSPL=1clk HG2 shows the level of the noise with the used threshold (35 bins) and with the H.V. Off. Z-Zoom (x10+4) 8
Latency Scan @ -4kV & with MSPL=2clk Z-Zoom (x10) – Reasonable with the variation of the gain vs the HV applied. It’s interesting also to observe the variation of the latency position of the maximum related to the amplitude of the signal. 9
EVEN LESS THAN PRELIMINARY Preliminary Efficiency Vth=35 bins 13
Example of Estimation in the worse case: -Gain 8k –Strips/Pads Sharing (50%) 4k –Single electrode type Sharing (worse condition 50%) 2k -Peak 2k x 13e- = 26ke- ~ 10% of Dynamic range for GEM If the noise s is 10bin(from CalPulse Test) i.e. ~ 5% of Dynamic range for GEM we will have the Landau peak at 2 s Signal to Noise Estimation 14.3
The Beam The sector on the GEM foil!! 15