Download
1 / 1
10 likes | 118 Views
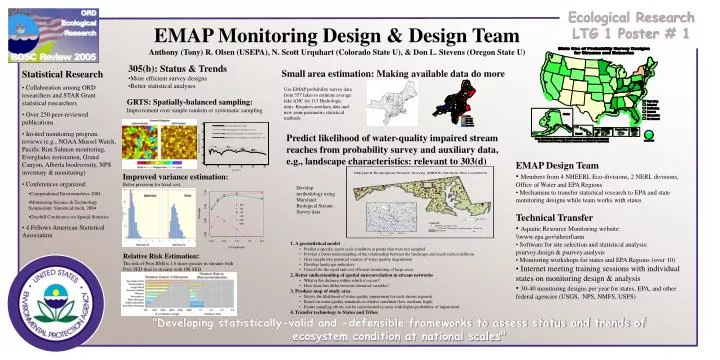
Ecological Research LTG 1 Poster # 1. EMAP Monitoring Design & Design Team Anthony (Tony) R. Olsen (USEPA), N. Scott Urquhart (Colorado State U), & Don L. Stevens (Oregon State U). 305(b): Status & Trends More efficient survey designs Better statistical analyses.

E N D
Ecological Research LTG 1 Poster # 1 EMAP Monitoring Design & Design Team Anthony (Tony) R. Olsen (USEPA), N. Scott Urquhart (Colorado State U), & Don L. Stevens (Oregon State U) • 305(b): Status & Trends • More efficient survey designs • Better statistical analyses Small area estimation: Making available data do more • Statistical Research • Collaboration among ORD researchers and STAR Grant statistical researchers • Over 250 peer-reviewed publications • Invited monitoring program reviews (e.g., NOAA Mussel Watch, Pacific Rim Salmon monitoring, Everglades restoration, Grand Canyon, Alberta biodiversity, NPS inventory & monitoring) • Conferences organized: • Computational Environmetrics 2004 • Monitoring Science & Technology Symposium: Statistical track, 2004 • Graybill Conference on Spatial Statistics • 4 Fellows American Statistical Association Use EMAP probability survey data from 557 lakes to estimate average lake ANC for 113 Hydrologic units. Requires auxiliary data and new semi-parametric statistical methods GRTS: Spatially-balanced sampling:Improvement over simple random or systematic sampling Predict likelihood of water-quality impaired stream reaches from probability survey and auxiliary data, e.g., landscape characteristics: relevant to 303(d) • EMAP Design Team • Members from 4 NHEERL Eco-divisions, 2 NERL divisions, Office of Water and EPA Regions • Mechanism to transfer statistical research to EPA and state monitoring designs while team works with states • Technical Transfer • Aquatic Resource Monitoring website: \\www.epa.gov\nheerl\arm • Software for site selection and statistical analysis: psurvey.design & psurvey.analysis • Monitoring workshops for states and EPA Regions (over 10) • Internet meeting training sessions with individual states on monitoring design & analysis • 30-40 monitoring designs per year for states, EPA, and other federal agencies (USGS, NPS, NMFS, USFS) Improved variance estimation: Better precision for fixed cost. Develop methodology using Maryland Biological Stream Survey data • A geostatistical model • Predict a specific reach scale condition at points that were not sampled • Provide a better understanding of the relationship between the landscape and reach scale conditions • Give insight into potential sources of water quality degradation • Develop landscape indicators • Crucial for the rapid and cost efficient monitoring of large areas • Better understanding of spatial autocorrelation in stream networks • What is the distance within which it occurs? • How does that differ between chemical variables? • 3. Produce map of study area • Shows the likelihood of water quality impairment for each stream segment • Based on water quality standards or relative condition (low, medium, high) • Future sampling efforts can be concentrated in areas with higher probability of impairment • 4. Transfer technology to States and Tribes Relative Risk Estimation: The risk of Poor BMI is 1.6 times greater in streams with Poor SED than in streams with OK SED.