Download
1 / 56
560 likes | 716 Views
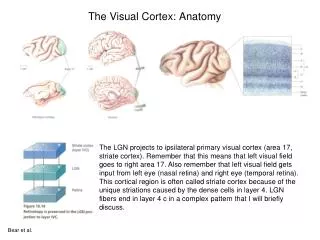
Mechanisms of orientation processing in the human visual cortex. Peter Wenderoth Department of Psychology Macquarie University, Sydney 2109. First-order (luminance defined) and second-order (contrast defined) gratings. … but they do respond to luminance gratings of the appropriate

E N D
Mechanisms of orientation processing in the human visual cortex Peter Wenderoth Department of Psychology Macquarie University, Sydney 2109
First-order (luminance defined) and second-order (contrast defined) gratings
… but • they do • respond to • luminance • gratings • of the • appropriate • spatial • frequency • so-called • first-order • stimuli It is well accepted that the visual cortex contains oriented linear filters which vary in size and which do not respond to equal stimulation of their “on” (black) and “off” (white) areas (or vice versa) ….
It appears that it is necessary to invoke another kind of non-linear filtering mechanism because we can easily detect certain kinds of stimuli which would stimulate equally all areas of a linear filter…... … so if we only had linear filters these so-called second-order stimuli would not be visible
This is noise (black and white dots randomly placed) modulated by luminance gratings and hence this is a first order stimulus One can tell that it is 1st order because in the dark bars both the lighter and the darker elements are darker than those in the light bars so that the bars differ in average luminance.
“carrier” “envelope” This is noise (black and white dots randomly placed) modulated by contrast and hence this is a second-order stimulus One can tell that it is 2nd order because the dark bars and light bars differ only in contrast - their average luminance is the same.
Another way to show this is to blur your eyes to get rid of high spatial frequencies of the dots leaving only the lower frequencies of the bars visible - the 1st order bars are still seen but the 2nd order ones disappear The same effect is achieved by minimising the size of the stimuli so that the dots that carry the contrast grating cannot be resolved
The luminance pattern (the carrier) that carries the contrast grating (the envelope) can be a grating (left) or noise (right)
Once again - simple cell filters in V1 would not be able to respond to 2nd order gratings because the average luminance would be the same all over the receptive field
Because simple cell filters in V1 would not be able to respond to 2nd order gratings, it has been suggested that there are 2 pathways from V1 to V2 - a linear one using simple cell receptive fields; and a non- linear one which rectifies - • either full-wave rectification so • that -ve values (dashed as in (a) • below) are made +ve; or • half-wave so that -ve values are • set to zero, as in (b) below ) (a) (b) . Full-wave rectification, for example, would turn the 2nd order stimulus into a white and grey luminance grating for subsequent linear filters
This is from Mather (2009). The small square at the top is defined purely by texture so it is 2nd order and first order filters (simple cells) could not “see” it. Row :2 But tiny simple cell ON-centre RFs do see the little +45˚ tilted texture elements. They are excited by the lines on the on-centre (white) and inhibited by light on the surround (dark areas). Row 3: Half-rectification makes the black areas grey so square has > luminance than surround Row 4: Simple cells with much bigger RFs can now extract the square with higher luminance : Row 5
There is much evidence for both linear and nonlinear pathways and the FRF model postulates a higher level at which the two pathways converge
Inducing grating Test grating The tilt illusion: a truly vertical test grating appears tilted when it is surrounded by a tilted inducing grating
MAXIMUM DIRECT EFFECT: +15˚ INDUCE MAXIMUM INDIRECT EFFECT: +75˚ INDUCE Central test grating appears tilted CCW - a repulsion effect Central test grating appears tilted CW - an attraction effect
deg deg
Wenderoth and Johnstone (“The different mechanisms of the direct and indirect tilt illusions”Vision Research, 1988a, pp. 301 -312) argued that direct TIs are low level (V1?) effects whereas indirect TIs are higher level, extrastriate effects. This was so because direct effects were reduced if inducing and test stimuli differed in low - level parameters such as spatial position, spatial frequency and size. Similar spatial differences did not reduce indirect effects. However, a square frame around the stimuli eradicated indirect effects but had no effect on direct effects
This double dissociation was strong evidence for different mechanisms of the direct and indirect effects and we have a lot of other evidence since then that direct effects occur in V1 and are due to lateral inhibitory processes whereas indirect effects occur in extrastriate cortex and are more to do with orientation constancy mechanisms
Given the FRF model, it was of interest to measure direct and indirect tilt illusions using both luminance modulated (LM) and contrast modulated (CM) gratings. The four conditions of particular interest were: INDUCETEST (1) LM LM (2) CM CM (3) LM CM (4) CM LM
Assume that the size of any effect will be reduced if some cells stimulated by the test grating were not stimulated by the inducing grating - i.e. TI = cells both induced and tested ÷ all cells tested … and note that the linear pathway will process only LM stimuli but the nonlinear one will process both CM and LM If a TI arises at a point before the CM and LM pathways merge, then in condition induce CM/test LM the LM test stimulus will be affected by the CM inducer in the CM pathway but not in the LM pathway - the LM pathway will carry veridical signals of test verticality and hence the TI will be reduced
If the TI is generated after the pathways converge then any type of contour - CM or LM - will interact fully with any other and the CM/LM effect will be the same size as all the others induced LM/LM CM/CM LM/CM tested linear nonlinear It is certainly the prediction that LM/LM = CM/CM = LM/CM whether the effects arise before or after combination - as shown here, in each case all cells tested will be affected by the inducer. In the case of LM/CM, some cells affected by the inducer aren’t tested but that’s not relevant.
CM/LM linear induced nonlinear tested In the remaining CM/LM condition, however, the CM inducer will affect only the 2nd order pathway but the LM test stimulus will test both, including the unadapted 1st order cells. Thus: So here, the TI should be smaller than maximum if it arises prior to the pathway combination in which case it is predicted that: LM/LM = CM/CM = LM/CM > CM/LM. If the TI occurs after combination, the prediction is that all effects will be equal.
The results obtained by Smith, Clifford & Wenderoth (Vision Research 2001 41 1057-1071) are: Repulsion - LM/LM = CM/CM = LM/CM > CM/LM Attraction - LM/LM = CM/CM = LM/CM = CM/LM N = 20
It was possible that the small CM/LM effects obtained were due to the relative lack of salience of the 2nd - order inducing grating - it might have acted as the equivalent of a low contrast luminance grating. To test this possibility, we ran another 10 subjects using the same 2nd order inducing gratings but varied the test grating contrast so that it was 0.2, 0.4 or 0.8. If the very small CM/LM effect in the previous experiment was due to the low effective contrast of the CM grating, then decreasing the 1st order test grating contrast should systematically increase the repulsion tilt illusion. The results with 10 subjects were -
These results clearly show that systematically decreasing test contrast does not effect orientation repulsion effects when a 2nd order inducing grating acts on a 1st order test grating.
CM/LM linear induced nonlinear tested CONCLUSIONS: We can conclude that repulsion TIs are generated before the linear and non-linear pathways converge because the results were consistent with uninduced but tested cells in condition CM/LM.
CONCLUSIONS: The repulsion effect results thus were consistent with the model which says that the magnitude of the TI = cells both induced and tested ÷ all cells tested The magnitude of “indirect” or attraction Tis can also be modelled by the ratio assumption that: TI = cells both induced and tested ÷ all cells tested. Attraction effects are probably generated in extrastriate cortex, after the linear and non-linear pathways converge. Consequently, all cells involved in attraction effects are always both induced and tested Thus, “indirect” or attraction TIs are “cue invariant” - they are independent of the kind of cue which specifies the inducing and test gratings and respond equally to all cue types.
McGraw, Levi & Whitaker (1999): Adapting to the antisymmetric Gaussian luminance windows in (a) for 20 seconds makes the central “ball” in (b) appear misaligned to the right; and in (c) appear misaligned to the left. This is a first-order positional aftereffect with directionally opposite effects on luminance increments (b) and decrements (c).
A The top row here is the same aftereffect but now with contrast-defined Gaussian blobs - a second- order version ....
McGraw et al. asked whether this 2nd order effect is tuned to carrier orientation: whether similar effects would or would not occur when the test carrier had the same orientation as the adaptor (as in b) or was orthogonal (as in d). They asked the same question about carrier spatial frequency.
Results: Carrier Orientation Luminance decrements (filled symbols) and increments (open symbols) both produced alignment errors. The authors stated that there was complete orientation crossover but this is false: triangles (orthogonal carriers) were always less displaced from zero than circles. So there is - albeit broad - orientation tuning with crossover 63-99% for the three observers
Spatial Frequency: There was clear spatial frequency tuning: Effects were largest when adapting and test carriers had the same frequency (circles); less for a 1 octave difference (triangles); and smallest for a 2 octave difference (squares)
Given both the psychophysical and neurophysiological evidence for the filter-rectify-filter (FRF) model of the cortical nonlinear pathway that processes second order contours … McGraw et al. concluded that populations of cells in the nonlinear pathway receive pooled orientation signals from first stage filters but that the output of first stage filters is not pooled across spatial frequencies That is, there is parallel processing of different spatial scales but within these spatial scales, orientation information is pooled
McGraw et al. noted the apparent discrepancy between their alleged finding of complete orientation crossover whereas single cell studies have reported broad tuning to the orientation of the carrier (Mareschal & Baker, 1998) .... .... but as we have just emphasized, that’s also what they actually found too.
There is now abundant psychophysical evidence that repulsion and attraction tilt illusions have different mechanisms Whereas attraction effects are thought to be determined by a single, higher level mechanism, probably extrastriate, repulsion effects are determined by that mechanism but largely by a lower level mechanism, probably arising in V1 (Wenderoth & Johnstone, 1987; 1988; Smith & Wenderoth, 1999; Clifford, Wenderoth & Spehar, 2000; Poom, 2000).
We wondered whether: • large orientation but not spatial frequency crossover, similar to that found by McGraw et al., would occur with the second-order tilt illusion • different patterns of crossover might occur with repulsion (direct) and attraction (indirect) effects • For example, one possibility is that partial early pooling occurs in V1 and is reflected in partial orientation crossover with repulsion effects; but that attraction effects arise after rectification and there is additional late pooling of orientation information, giving more complete crossover in the case of attraction effects
Methods and Procedures Apparatus and stimuli • Experiments used a PC with a CRS VSG 2/3 graphics card. • Stimuli were presented on a 21” Sony GDM-20SE 2T5 monitor and consisted of a 2-deg diameter test grating surrounded by a 6-deg outside diameter inducing grating. • Carrier spatial frequency was either 4.5, 6 or 9 cpd (Expts 1 and 2) or 9 cpd (Expt 3). Envelope spatial frequency was 1.5 cpd. Carrier contrast was 60% (Expts 1 and 2) or 90% (Expt 3) with complete depth of modulation. Test carrier orientation was always +45 deg (clockwise), inducer carrier orientation was either +45-deg (parallel) or –45-deg (orthogonal). To induce repulsion and attraction effects, the inducing envelope was oriented 15-deg or 75-deg, respectively.
An example of the kind of stimulus used Subjects judged the apparent tilt of the contrast envelope
Subjects All subjects were emmetropic or wore corrective lenses. Experiment 1: 2 experienced psychophysical observers and 37 volunteers from an introductory Psychology course at Macquarie University, who participated in return for nominal course credit. Experiment 2: 10 of the volunteer subjects and 6 experienced observers. Experiment 3: 17 subjects provided repulsion effects, 3 experienced psychophysical observers, 2 volunteers and 12 students in an advanced 3rd year Perception course. 25 subjects were tested on attraction effects, 20 3rd year students and 5 experienced observers.
Procedures Subjects indicated perceived tilt left or right of vertical by pressing a key on a response box. Stimuli were viewed through a matte black circular viewing tube from a distance of 57 cm and masks removed all cues to vertical and horizontal. All stimuli were flashed for 100 msec. A randomly interleaved double staircase with 8 reversals was used. Step size began at 1-deg and was incremented by 0.5-deg at a time if a subject had difficulty completing any run. Only the last 6 reversals were used to calculate the illusion. The point of subjective vertical was measured twice, once with the inducing envelope tilted +15 (or 75) deg and once with it tilted –15(or 75) deg. The magnitude of the tilt illusion was taken to be half the clockwise-induced effect minus the counterclockwise-induced effect, so that repulsion effects were signed +ve, attraction effects –ve.
Experiment 1: Do second-order repulsion and attraction • tilt illusions transfer across different inducer and test • stimulus carrier orientations? Repulsion effect: 39 subjects - 12 with carrier frequency 4.5 cpd - 13 with carrier frequency 6.0 cpd - 14 with carrier frequency 9.0 cpd Attraction effect: 35 subjects - 12 with carrier frequency 4.5 cpd - 11 with carrier frequency 6.0 cpd - 12 with carrier frequency 9.0 cpd
Repulsion effects ... • Increased with • carrier spatial frequency, p<0.005 • Were larger with parallel test and inducing carriers, p<0.002 • Both parallel and orthogonal carrier • effects were different from zero, p<0.0005 in each case
Attraction effects ... • Showed no effect of carrier spatial frequency • Were not different for parallel and orthogonal carriers • Both parallel and orthogonal carrier • effects were different from zero, p<0.0005 in each case
Experiment 2: Do second-order repulsion and attraction tilt • illusions transfer across different inducer and test stimulus • parallel carrier spatial frequencies? • Repulsion effect: 10 naive volunteers • Attraction effect: 10 naive volunteers plus 6 experienced observers • Seven pairs of test/inducer spatial frequencies : 4.5/4.5; 6.0/6.0; • 9.0/9.0; 4.5/9.0; 9.0/4.5; 6.0/9.0 and 9.0/6.0 • By using the 9/9 cpd condition in two separate analyses, it was • possible to examine spatial frequency crossover between 4.5 and • 9 cpd in one pair of repulsion/attraction effect analyses and also the • crossover between 6 and 9 cpd in another set of analyses.
Repulsion effects ... • Top panel: • Larger illusions with same (+2.04 deg) than • different (+0.68 deg) carrier frequencies, • F (1,9) = 101.6, p <0.0001. Larger illusions • with higher test carrier frequency, F (1,9) = • 26.1, p = 0.0006. • Bottom panel: • Larger illusions with same (+2.33 deg) than • different (+1.13 deg) carrier frequencies, • F (1,9) = 14.52, p =0.004. Larger illusions • with higher carrier frequency, F (1,9) = 15.0, • p = 0.004.
Attraction effects ... • Top panel: • Larger obtained illusions with same • (- 0.72 deg) than different (- 0.30 deg) carrier • frequencies and larger illusions • with higher test carrier frequency, but neither • statistically significant. • Bottom panel: • Larger illusions with same - 0.76 deg) than • different (- 0.38) carrier frequencies, • F (1,15) = 6.44, p =0.02. Larger illusions • with higher test carrier frequency, but not • statistically significant
The results of Experiments 1 and 2 suggest that orientation crossover exceeds spatial frequency crossover, as found in the context of a positional aftereffect by McGraw et al. (1999). This was particularly so in the case of the attraction effect where there was complete orientation crossover in Experiment 1 but only partial spatial frequency crossover in Experiment 2.
Experiment 3: To what extent do second-order repulsion and • attraction tilt illusions exhibit IOT with same or different inducer • and test stimulus carrier orientations? Repulsion effects: 17 subjects, 3 experienced psychophysical observers, 2 volunteer students and 12 students from an advanced 3rd year course on Perception. Attraction effects: 25 subjects, 20 3rd year students and 5 experienced observers. 2 repeated measures conditions: Adapt/test same vs different eye (called MON/MON vs IOT); and parallel vs orthogonal carrier A mirror stereoscope with fusion lock stimuli was used to present stimuli to the two eyes separately