Download
1 / 31
450 likes | 673 Views
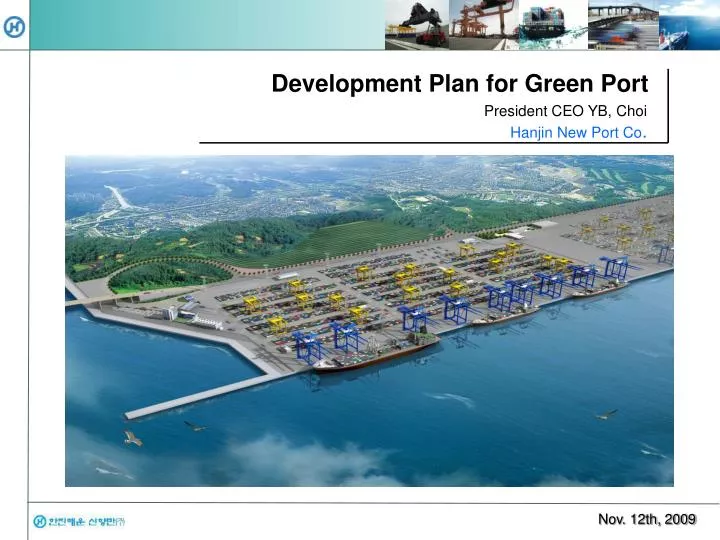
Development Plan for Green Port. President CEO YB, Choi Hanjin New Port Co. 한진해운 신항만㈜ 대표이사 최 영 배. Nov. 12th, 2009. Contents. 1. Environmental issues and Global warming 2. International concern and Trends 3. Domestic Situation and Response 4. Environmental issues in Logistics

E N D
Development Plan for Green Port President CEO YB, Choi Hanjin New Port Co. 한진해운 신항만㈜ 대표이사 최 영 배 Nov. 12th, 2009
Contents 1. Environmental issues and Global warming 2. International concern and Trends 3. Domestic Situation and Response 4. Environmental issues in Logistics 5. Green port status and Action plan for domestic ports 6. HJNC’s action plan for Green port 7. Conclusion
Environmental issues and Global warming 1 Global warming The world’s average temperature rise and the rapid melting of polar glaciers The reduction rate of polar glaciers per year 3
Environmental issues and Global warming 1 Environmental crisis clock 2008 current time 09:33 12:00 Impossible for humans to live 00:01~3:00 Not anxious 9:01~12:00 Very anxious 12 9 3 3:01~6:00 A little anxious 6:01~9:00 Quite anxious 6 4
2 International concern and Trends Agreements The history of conventions on climate change between countries United Nations Framework Convention on Climate Change (UNFCCC) 1992 UNCED in Rio EU and 37 developed countries discuss reducing greenhouse gas emissions 1997 Adoption of the Kyoto Protocol Arrange specific implementation plans of the Kyoto Protocol 2001 Adoption of Marrakesh agreement Arrange 1st commitment period of greenhouse gas reduction (2008~2012) 2005 The Kyoto Protocol entered into force Raised the need to reduce greenhouse gas in developed countries 2007 Bali Roadmap Discuss new post-Kyoto Protocol (2013~) 2009 Copenhagen Conference 5
2 International concern and Trends The schedule after Effectuation of the Kyoto Protocol 2008 2013 2005 2018 2nd Performance period 1st Performance period Effectuation of the Kyoto Protocol Developed countries reduce greenhouse gas emissions. South Korea inevitably participates. Negotiating reduction for the 2nd performance period: South Korea under pressure to reduce greenhouse Gas emissions. 6
Obama, President of U.S. World-wide environmental declaration 2 International concern and Trends 1 • 80% reduction in greenhouse gas(CO2) emissions by 2050 2 • Approving the global warming treaty 3 • Investing in alternative energy 4 • creating 5 million ‘green jobs’ 1 • In Journalism: Rupert Murdoch 2 • In Shipping: MAERSK, Evergreen, MOL 3 • In Industry: GE의 Ecomagination (Toyota, BP) 4 • In distributing: Wal-Mart, Tesco 7
3 Domestic situation and Response Domestic Reality Energy consumption and Pollutant emissions in South Korea • Increase greenhouse gas emissions continuously • The average annual growth rate of 7.9% in greenhouse gas from 1990 to 1997, higher than • the growth rate of 7.1% in GDP • Continuously increase proportion of energy-guzzling industries (steel, petrochemical industry) • since 1990 • Rapidly increase greenhouse gas emissions per capita from 1.9TC/Capita in 1990 to 3.1TC/Capita • in 1997 (World lanking) If obligations to reduce greenhouse gas emissions are charged hereafter, Korean economic growth could shrink concerning the difficulty of its Reduction in Korean circumstances. 8
3 Domestic situation and Response Domestic reality and Respond Korean President’s “Green growth” Declaration: Selected as a national challenge Aug 5th, 2008 Forming eco-friendly business & energy-saving infrastructure Developing new industries to respond to climate change Improving independent energy & Creating green Korean Peninsula Developing renewable energy & clean energy Research actual emissions of greenhouse gas in logistics and accept plans and road map to attain target for greenhouse gas reduction. Included in parties to UNFCCC from 2013 9
4 Environmental issues in Logistics Trends in domestic private companies Hanjin Shipping 1 • Operate fuel-saving service lanes (BSP : Bunker Saving Program) 2 • Streamlined routes, Vessel speed reduction 3 • Install new shipbuilding AMP (Alternative Maritime Power) POSCO 1 • Steadily expand volume of eco-friendly marine & rail transportation 2 • Secure competitiveness through diversification of transportation 3 • Reduce distribution costs by road damage & mass transportation Domestic companies haven’t recognized environmental issues yet. Government’s measure also isn’t specific. 10
4 Environmental issues in Logistics CO2 emission Ratio by industry Source : International Energy Agency 11
4 Environmental issues in Logistics Energy Consumption by Transportation mode Source : Development plan for Modal Shift to establish eco friendly logistics system KMI(2008) ■ To reduce Co2 emission, Developed countries are trying to reduce the utilization of truck and tend to increase utilization of Ship or Rail transportation which is more eco friendly transportation ■ utilization of road transportation increases gradually. But, usage of transportation via sea and rail tends to decrease 12
4 Environmental issues in Logistics Environmental issues in Logistics Global Warming It caused by CO2 from vehicles and Vessels Causing from Air conditioner of Vehicle, Reefer Container, refrigeration/freezer Tank Ozone Depletion It caused by Sox, Nox from Vehicles and Vessels Acid Rain Marine Pollution Oil Spills by Marine Accident Destruction of Rainforest Using packing material for transit & Pallet Exhaustion of resources Exhaustion of petroleum resources 13
4 Environmental issues in Logistics Countermeasures from many countries Transferring to Rail and Ship (Mass Transportation) Automation Equipment WMS, Cross Docking System introduction Subsidy and tax benefits to applicable company Green logistics certification system Modal Shift Subsidy & Incentive Eco-friendly vehicles, Electronic Vehicle Introduction of advanced logistics management techniques In case of switching to eco-friendly Transportation E-RTGC reusable packaging container &Pallet 14
5 Green port status and Action plan Eco Friendly Port Technology Eco Friendly Port Operation Technology Eco Friendly Green Terminal In short term In mid term In long term In Charge • Vessel Speed ↓ • Fuel Change • Catalyst • Controller for fuel usage • Automated berth system • AMP • Clean Vessel Liner • Non peak incentive • 24 hour operation • C/C ability ↑ • Multi spreader • advanced equipment • C/C unit increase • new C/C development • Relocation • proper facility size • Non stop at gate • gate separation Terminal Operator Trucking/ Shipper • Modal Shift • Fuel Change • Multi vehicle • Clean vehicle input
5 Green port status and Action plan Eco Friendly Port Technology Equipment change • Required a gradual replacement due to costing a lot of money E-RTGC existing RTGC Source : Haesa economy paper(2009.02.06), http://www.ihaesa.com/News/list_view.html?Pass=IB-5-23065 ■ Replacement cost of 1T/C with E-RTGC is364 million won. Total replacement cost of RTGC in existing North port is 50,960 million won. 16
5 Green port status and Action plan Eco Friendly Port Technology • Exhaust Gas emission reduction by installing AMP • (Alternative Maritime Power) Equipment adopt (AMP) • Nox 1 Ton decrease • Sox 0.5 Ton decrease AMP install Expected result Source : Hae Sa newspaper (2009.02.06), http://www.ihaesa.com/News/list_view.html?Pass=IB-5-23065 ■ Install Cost is 2.5 billion won per berth. Estimated cost for installing 50% berth in Busan is about 35 billion won 17
5 Green port status and Action plan Eco Friendly Port Technology Green House Gas by mode Most eco friendly mode is transportation via Sea and next is via Rail (Unit : g/ton-km) Via Sea Via Rail Gas Trucking 0.04 0.2 CO 0.5 15 28 CO₂ 98 0.01 0.1 HC 0.2 0.3 0.5 NOx 1 0.3 0.04 SO₂ 0.03 Source : Development plan for Modal Shift to establish eco friendly logistics system KMI(2008) ■ Rank for Co2 gas emission: trucking (98g/ton-km) – via rail (28g/ton-km) – via Sea (15g/ton-km) ■ Most eco friendly transportation mode is marine transportation 18
5 Green port status and Action plan Eco Friendly Port Technology Social Indirect Cost Marine transportation is the most competitive in terms of social indirect cost including pollution and noise and etc. (Unit : won/ton-km) Via Sea Via Rail Cost Land Trucking 8.1 12.2 Air pollution 82 0 2.3 Noise 13 0.8 6.9 Accident 135.9 0 0 Congestion 18 0 22.3 Maintenance 5.6 8.9 43.7 Total 254.5 Source : Development plan for Modal Shift to establish eco friendly logistics system KMI(2008) 19
5 Green port status and Action plan Eco Friendly Port Technology Rear Transportation Tucking takes up 90% of the rear transportation of the port Need for various transportation mode Joint Delivery required Existing Hardware available No need for additional investment Requiring Gov, Subsidy or incentives for stable service 20
6 HJNC Action Plan for Green Port Ship Shuttle For better T/S connection between North and New Port, Modal Shift started with BPA incentives from trucking to Ship Shuttle Service Modal Shift North Port BICT/OTHERS New Port HJNC/PNC
6 HJNC Action Plan for Green Port Ship Shuttle Handling over 5,000 TEU per month except for starting month Volume ■ Total 15,757 TEU of T/S containers were handled via Ship Shuttle from trucking since the start of operation during last 3 month
6 HJNC Action Plan for Green Port Ship Shuttle Social indirect cost reduction is about 1.9 billion won by transferring to Ship Shuttle Social Indirect Cost Saving Source: Considered Air pollution, Noise, Accident, Congestions, M&R Cost (referring to Page 19) 23
6 HJNC Action Plan for Green Port Ship Shuttle Exhaust (gas) Emission Reduction Co2 emission reduced by 187,933Ton via Ship Shuttle for the last 3 months starting from July 2009 (Unit : ton) ■ Co2 emission cost is 14.40Euro/Ton(as of 09.11.04) and its total reduced amount reached 4.7 billion won 24
More options from various transportation mode • Risk management in case of strike or emergency • Service quality increase by competition Cost Saving Modal Shift 6 HJNC Action Plan for Green Port Expected effect from Ship Shuttle • Strengthening T/S connection between New & North port • New liner or T/S volume increase thru Co-opetition with North port • Primary example of synergy created by cooperation with North port Strengthening Connection (New port – North port) • Compared to trucking, 40,000 won / move reduction with BPA • incentive • Social indirect cost reduction monthly 500 Mil won • Co2 emission cost reduction monthly 1.2 Billion won 25
[ 6 HJNC Action Plan for Green Port Coastal service • Securing various transit mode between Pohang & Busan from trucking of steel cargos • Indirect cost resulted from heavy & over-freight cargos Modal Shift Po hang [ Transportation via Land / Sea] Busan
6 HJNC Action Plan for Green Port Coastal Transportation • Targeting monthly 6,400 TEU from new port to Pohang Target Volume • Targeting monthly 1,610 TEU from Pohang to New Port (Unit : TEU) 27
6 HJNC Action Plan for Green Port Indirect cost reduction Indirect cost savings are monthly 7.5 billion won via sea transportation Source: Considered air pollution, Noise, accident, Congestions, M&R Cost (referring to Page 19) Exhaust gas Emission Decrease Co2 emission was decreased by 2.7 million ton via sea transportation (Unit : Ton) ■ Co2 emission cost is 14.4 Euro/ton (As of 09.11.04) and, the amount reached 7.4 billion won 28
수/출입 화물의 대부분이 철강관련 아이템으로 만성적인 과적 문제 • 내륙 운송 중심에서 다양한 모드 선택 가능 • 육상운송 경쟁을 통한 서비스 질 향상과 합리적인 가격 • 수/출입 화물의 대부분이 철강관련 아이템으로 만성적인 과적 문제 • 내륙 운송 중심에서 다양한 모드 선택 가능 • 육상운송 경쟁을 통한 서비스 질 향상과 합리적인 가격 • Chronic over freight problem (Steel, Metals) • Various mode available instead of inland trucking • Securing competitive price & qualified service by competition Modal Shift Modal Shift Modal Shift 6 HJNC Action Plan for Green Port Expected effect by coastal SVC • Terminal volume increase by coastal service • Activation of two port via cooperation with Po-hang • Synergy from cooperation between Po-hang & Busan Strengthening Connection (Pohang – Busan) • Social indirect Cost reduction Monthly 7.5 Billion won • 74 billion won reduction by Co2 emission decrease Cost Saving 29
Conclusion 7 Key factors For Success Government Subsidy required for high cost & eco-friendly modal shift 2. Perception Change (Shipper/ Trucker) 3. Founding Committee related to Carbon tax, Tradable pollution permits 4. Transportation mode development with less emission 5. Incentives from int’l organizations by Green Port Certificate 30
Thank You Your Choice Your success