Download
1 / 16
160 likes | 396 Views
Area Principle . The area occupied by a part of the graph should correspond to the magnitude of the value it represents. . Contingency Tables. A table that shows how the individuals are distributed along each variable, contingent on the value of the other variable. marginal distribution

E N D
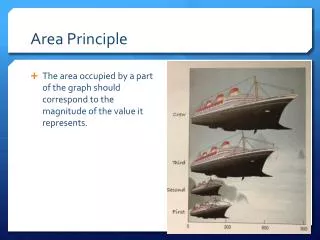
Area Principle • The area occupied by a part of the graph should correspond to the magnitude of the value it represents.
Contingency Tables • A table that shows how the individuals are distributed along each variable, contingent on the value of the other variable. • marginal distribution • conditional distribution
Did the chance of surviving the Titanic sinking depend on ticket class??
Chapter 3 Displaying and Describing Categorical Data *Independence *Contingency Tables *What can go wrong?
Independence • In a contingency table, when the distribution of one variable is the same for all categories of another, the variables are INDEPENDENT • No association between the variables • Just Checking pg 28
Examining Contingency Tables • Medical researchers followed 6272 Swedish men for 30 years to see if there was any association between the amount of fish in their diet and prostate cancer. Prostate Cancer Fish Consumption
Process • Think • State the problem • Identify the variables and the W’s • Check any conditions • Show • Mechanics (crunch numbers and make displays) • Tell • Conclusion – interpret the patterns in the table and displays in context. Discuss possible real-world consequences. Be careful not to overstate what you see.
What Can Go Wrong? • Do NOT violate the area principle. • 3-D graphs and graphs shown at an angle are fun but not accurate • Keep it honest. • Pie charts should have a total of 100% • Be careful with percentages that sound similar • the percentage of the passengers who were both in first class and survived vs the percentage of first-class passengers who survived
What Can Go Wrong? • When looking at contingency tables or conditional distributions, be sure to look at the variables individually as well • Be sure there are enough individuals for each category. • We found that 66.7% of the rats improved their performance with training. The other rat died. • Don’t overstate your case • Independence is an important concept, but it is rare for two variables to be entirely independent. We can not conclude that one variable has no effect whatsoever on another. Usually all we know is that little effect was observed in our study.
What Can Go Wrong? • Don’t use unfair or sill averages. • Averages can be misleading. Be careful when averaging different variables that the quantities you’re averaging are comparable.
Simpson’s Paradox • When averages are taken across different groups, they can appear to contradict the overall averages. • Moral: • Be careful when you average across different levels of a second variable • Its always better to compare percentages or other averages within each level of the other variable • The overall averages may be misleading
It’s the last inning of an important game. Your team is a run down with the bases loaded and two outs. The pitcher is due up, so you’ll be sending in a pinch-hitter. There are 2 batters available on the bench. Who should you send into bat?
Now who would you choose now? Pooling the data together loses important information and leads to the wrong conclusion. We always should take into account any factors that might matter.