Download
1 / 21
210 likes | 350 Views
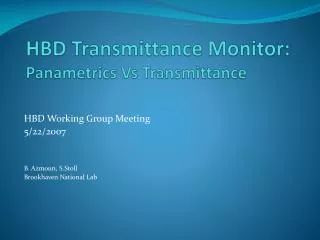
HBD Transmission Monitor Update III: Noise Analysis. HBD Working Group Meeting 10/10/06. B. Azmoun & S. Stoll BNL. Low Sensitivity at either end of Trans. plot. Low Sensitivity in regions of spectrum where light output is low In these regions the Trans. Calc is more susceptible to

E N D
HBD Transmission Monitor Update III: Noise Analysis HBD Working Group Meeting 10/10/06 B. Azmoun & S. Stoll BNL
Low Sensitivity at either end of Trans. plot • Low Sensitivity in regions of spectrum • where light output is low • In these regions the Trans. Calc is more • susceptible to • Incorrect Subtraction of the DC • Fluctuations in the Bckgnd “Noise” • Component • Signal consists of 3 Components: • Background Noise • Dark Current (DC) • pe Signal B. Azmoun
How Trans. Is Calculated as a function of Wavelength Expression for Transmittance Calculation: S: Sample Scan Current (Gas) R: Reference Scan Current (Vac) Ms: Monitor Current during sample scan MR: Monitor Current during ref. scan D: Corresponding Dark Current (Const.) • The PMT current at each wavelength is measured during an automated wavelength scan, where the scan progresses in 1 nm steps over a range from 110 to 190nm. • The current value at each wavelength is taken as the mean of 100 ammeter readings, corresponding to a sampling time of 17 sec. (including digital and analog filtering) • The PMT DC is NOT measured point-by-point, but only for 2 data points before and after the scan (as you’ll see later, this has to be improved). The four data points are averaged and this constant is then subtracted off of the current value at each wavelength: IPMT(l) – DC. • As specified above, the transmittance calc. is then a ratio of the pe current (with the DC subtracted off) measured when the cell is filled with gas and under vacuum. This ratio is then normalized to a ratio of lamp monitor measurements, each taken simultaneously with the corresponding Sample or Ref. measurement. B. Azmoun
Effect of DC on Trans. Calc. • The Trans. Calc. becomes strongly dependent on an accurate • measurement of the DC once the DC value becomes comparable to the pe signal • Easy Fix: measure DC for more than just 4 data points perhaps 20? Ref. DC Underestimated • The plots to the left represent the same measurement with different (artificial) values of DC subtracted off the pe signal • Depending on which of the four DC values in the Trans. expression are measured incorrectly, the Trans. plot will exhibit either an effective absorbance, or an effective Trans. greater than 100% • Even once the DC is subtracted off correctly, small systematic variations in the Trans. may remain, and represent the small (yet relatively significant), and slow variations in the DC [These systematic variations reveal the limits of the approx. made in the Trans. Calc., namely the assumption that the DC is constant—here it pays to have a PMT w/ low DC] Ref. DC Overestimated Ref. DC ~ Flat Trans. B. Azmoun
Scans of Noise, Dark Current and pe Current for each PMT of each Cell of Trans. Monitor • Similar to the systematic modulation of the Trans. curve caused by the incorrect subtraction of a constant, fluctuations in the PMT current will also have a strong impact on the Trans. curve in regions of low light. Once the fluctuations in the currents become comparable to the pe signal + DC, the change to the transmittance may be represented by the following expression, which includes a time dependent component, d(t). As is shown in the following plots, this time dependent component has a common source: External noise coupling to the DC + pe signal. Therefore, dS = dR = dMS = dMR.
CELL 1 Mon. PMT = PA0085Cell PMT = PA0089 B. Azmoun
Noise & DC Spectra B. Azmoun
CELL 2 Mon. PMT = PA0085Cell PMT = PA0088 B. Azmoun
Noise & DC Spectra B. Azmoun
CELL 3 Mon. PMT = PA0085Cell PMT = PA0086 B. Azmoun
Noise & DC Spectra B. Azmoun
Lab spectrometer Mon. PMT = PA0038Cell PMT = PA0080 B. Azmoun
Noise & DC Spectra B. Azmoun
Summary Plots: Comparison of Lab DC and HBD Trans. Mon. DC Measurements ~45min B. Azmoun
Summary of Observations • The Noise of both the “Monitor” and “Sample” are well correlated • The sigma for both (Noise) and (Noise + DC) are strongly correlated. • The Trans. Mon. DC is ~const. • sigma(Noise + DC) – sigma(Noise) ~ ZERO • The mean DC of (at least one of) the Lab PMT’s is about the same as the Trans. Mon. PMT’s (~10pA). BUT, the fluctuations of (DC + Noise) for the Lab Spect. are a factor of ~100 less than for the Trans Mon. ( tens of pA Vs tenths of pA), due to the fluctuations in the noise component of (Noise + Signal), not due to the DC component. • Thus, the Trans. Monitor PMT’s are probably Ok. B. Azmoun
Sigma/Mean: Comparison of Lab Spectrometer to HBD Trans Mon. • Sigma/Mean of HBD Trans Monitor is similar to that of the Lab spectrometer, even • though the Lab spect. has about a factor of 10 - 20 less light…the larger fluctuations • in the HBD Trans. Monitor offset the increase in light output. B. Azmoun
Long Duration Scans (DC & Signal) B. Azmoun
Sigma B. Azmoun
Noise & DC Spectra Vs Time B. Azmoun
Mean DC and Avg. Fluctuation Vs Time Even over a very long duration (~13hrs.) DC is ~Constant, while the fluctuations in the Monitor and Sample Scans remain Strongly Correlated B. Azmoun
To Do … • Investigate Noise Issues • Lab Noise is a problem in general • What is different between Lab Spect. and HBD Trans monitor • Flow CF4 and check compatibility with Al collimation tube (coated with black layer of ???) B. Azmoun