Download
1 / 31
310 likes | 464 Views
Chapter 4. The Dujiangyan Irrigation System. 4. Natural and Environmental Resources. 4.1 Natural resources 4.2 Energy production 4.3 Environmental quality 4.4 Chinese environmental policy 4.5 Policy implications. Keywords :. natural resource, minerals, energy,

E N D
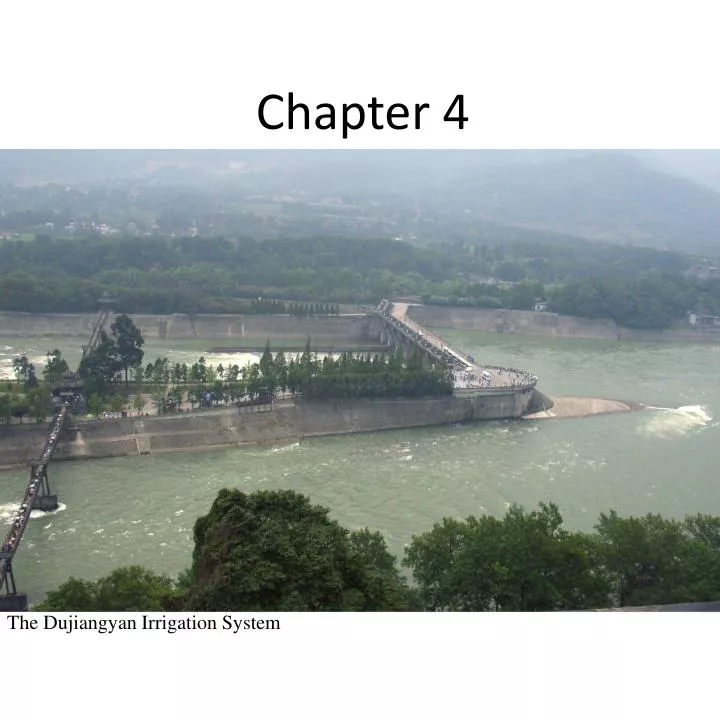
Chapter 4 The Dujiangyan Irrigation System
4. Natural and Environmental Resources 4.1 Natural resources 4.2 Energy production 4.3 Environmental quality 4.4 Chinese environmental policy 4.5 Policy implications
Keywords: • natural resource, • minerals, • energy, • resource consumption, • spatial disequilibrium, • sustainable development, • pollution, • greenhouse gas (GHG), • environmental protection
4.1 Natural resources 4.1.1 Land and agriculture 4.1.2 Mineral resources 4.1.3 Water scarcity
Top five provinces in agriculture: • Hunan, Sichuan, Jiangsu, Hubei, and Guangdong for rice • Henan, Shandong, Jiangsu, Hebei, and Sichuan for wheat • Shandong, Jilin, Hebei, Sichuan, and Henan for maize • Heilongjiang, Henan, Jilin, Shandong, and Anhui for soybean • Shandong, Hebei, Henan, Hubei, and Jiangsu for cotton • Shandong, Sichuan, Anhui, Jiangsu, and Henan for rapeseeds • Henan, Yunnan, Shandong, Guizhou, and Hunan for tobacco • Zhejiang, Hunan, Sichuan, Anhui, and Fujian for tea • Shandong, Hebei, Guangdong, Sichuan, and Liaoning for fruits
Major resource-rich provinces (in order of reserves): • Argentum (Ag): Jiangxi, Guangdong, Guangxi, Yunnan, Hunnan • Bauxite: Shanxi, Henan, Shandong, Guangxi, Guizhou • Bismuth (Bi): Hunan, Guangdong, Jiangxi, Yunnan, Inner Mongolia • Chromium (Cr): Tibet, Inner Mongolia, Gansu • Coal: Shanxi, Inner Mongolia, Shaanxi, Guizhou, Ningxia • Collat. (Co): Gansu, Yunnan, Shandong, Hebei, Shanxi • Copper (Cu): Jiangxi, Tibet, Yunnan, Gansu, Anhui • Gold (Au): Shandong, Jiangxi, Heilongjiang, Jilin, Hubei • Hydragyrum (Hg): Guizhou, Shaanxi, Hunan, Sichuan, Yunnan • Iron (Fe) ore: Liaoning, Sichuan, Hebei, Shanxi, Anhui • Kaolin (Ka): Hunan, Jiangsu, Fujian, Guangdong, Liaoning
(Cont’d) • Lead (Pb): Yunnan, Guangdong, Hunan, Inner Mongolia, Jiangxi • Manganese (Mn): Guangxi, Hunan, Guizhou, Liaoning, Sichuan • Molybdenum (Mo): Henan, Jilin, Shaanxi, Shandong, Jiangxi • Natural gas: Sichuan, Liaoning, Henan, Xinjiang, Hebei, Tianjin • Nickel (Ni): Gansu, Yunnan, Jilin, Sichuan, Hubei • Petroleum: Heilongjiang, Shandong, Liaoning, Hebei, Xinjiang • Platinum (Pt): Gansu, Yunnan, Sichuan • Silica stone (SiO2): Qinghai, Beijing, Liaoning, Gansu, Sichuan • Stibium (Sb): Hunan, Guangxi, Guizhou, Yunnan • Tantalum (Ta): Jiangxi, Inner Mongolia, Guangdong, Hunan, Sichuan • Tin (Sn): Guangxi, Yunnan, Hunan, Guangdong, Jiangxi • Titanium (Ti): Sichuan, Hebei, Shaanxi, Shanxi • Tungsten (WO3): Hunan, Jiangxi, Henan, Fujian, Guangxi • Vanadium (V): Sichuan, Hunan, Gansu, Hubei, Anhui • Zinc (Zn): Yunnan, Inner Mongolia, Guangdong, Hunan, Gansu
Table 4.2 Composition of energy resources, by region and by type of energy (%) Notes: (1) The geographical scopes of the great regions are defined in Figure 2.1. (2) Figures in parentheses are energy structures. (a) The theoretical reserves multiplied by 100 years. (b) Includes natural gas and shale oil. (c) Standard coal equivalent conversion rates are as 0.714 t/t for coal, 1.43 t/t for petroleum, 1.33 t/1000m3 for natural gas, 0.143 t/t for oil shale, and 350 g/kWh for hydropower.
(Source: The Ministry of Water Conservation of China and author) Figure 4.1 Regional differences of annual precipitation in mainland China
4.2 Energy production 4.2.1 Coal 4.2.2 Petroleum and natural gas 4.2.3 Clean/green energy
Source: Central Intelligence Agency (Washington, DC, 1983) and author. Figure 4.2 The distribution of minerals and energy resources in mainland China
Notes: (1) Each of Guangdong, Hainan, Jilin, Guangxi, Jiangsu, Hubei, Beijing, Tianjin, Fujian, Zhejiang, Tibet, and Shanghai is less than 1%. (2) Sichuan and Chongqing are estimated by the author based on their total reserves and land areas proportionally. Source: Sun (1987, pp. 4-8) and author. Figure 4.3 Spatial distribution of major mineral resources in China
Figure 4.4 China’s energy production structure, 1952-2009 Source: NBS, various years.
Source: BP Statistical Review of World Energy, 2011. Figure 4.5 China’s oil production and consumption (million tones), 1965-2010
4.3 Environmental quality 4.3.1 Air 4.3.2 Water 4.3.3 Land 4.3.4 Deforestation and desertification
Table 4.3 Greenhouse gas (GHG) emissions, China and USA Notes: GDP=gross national product, POP=population, LA=land area. (a) Measured in exchange rates (for China) and in current prices (for China and USA). Sources:WRI (1992), NEAA (2007) and author.
Source: EIA (2011). Figure 4.6 China’s carbon dioxide emissions from consumption
4.4 Chinese environmental policy 4.4.1 About sustainable development 4.4.2 China’s commitments to the environment 4.4.3 Unresolved issues
Table 4.4 Shares in consumption of primary commodities for China, India and USA (%)
Notes: “+” denote positive relations; “” denote negative relation; “” denotes causal direction. Figure 4.7 Economic, environmental and health relations
China’s double-track environmental management regime • Provinces and autonomous regions prefecture or municipalities counties and urban districts non-state and private enterprises; and • State commissions ministries and other government branches and state corporations at ministry and semi-ministry levels state-owned enterprises.
Law of Mineral Resources of the PRC (kuangcanziyuanfa): ... those who use destructive methods to extract mineral resources should refund the loss of damages and, if the resources have been seriously damaged, be additionally charged till the withdrawal of their certificates for mining permission at the most serious situation… Problems: (i) Which kinds of extraction methods should be defined as ‘destructive‘ to mineral resources? (ii) How to set up the standard of the ‘serious damages‘ to resources? (iii) How to calculate the ‘loss of damages‘? (iv) How to determine the amount of ‘additional charges‘? (v) What should be defined as the ‘most serious situation‘? Article 44 says:
Case Study 4 The South-North Water Transfer Project
Figure 4.8 The three routes of the South-North Water Transfer Project Source: Author.
Table 4.5 The basic indicators of the South-North Water Transfer Project
Chapter conclusion: The vast size and diversified natural conditions of China have generated many regional differences in terms of climate, geography, soil fertility and other natural resource endowments. This in turn means that social and economic developments vary from region to region. In particular, South and East regions have natural advantages for agriculture over the Northwest region. Except for a few deposits of non-ferrous metals, minerals and energy resources are much richer in the North and West areas than in the Southern coastal area. One of the most important implications of this chapter is that the unevenly distributed and coal-dominated energy structure is the major obstacle to Chinese industrialization and sustainable development. All of these factors have inevitably resulted in great spatial economic disequilibria and disparities in China. This chapter also discusses China’s worsening environmental problems.
Suggested reading Almond, Douglas, Yuyu Chen, Michael Greenstone and Hongbin Li (2009). “Winter Heating or Clean Air? Unintended Impacts of China's Huai River Policy,” American Economic Review, Volume 99, Issue 2. Cao, Jing (2008). “Measuring Green Productivity Growth for China's Manufacturing Sectors: 1991–2000,” Asian Economic Journal, Volume 21, Issue 4, pp. 425–451. Chen, Shaofeng (2011). “Has China's Foreign Energy Quest Enhanced Its Energy Security?” The China Quarterly, Volume 207, pp. 600 - 625. Cho, Mun Young (2010). “On the Edge between “the People” and ‘the Population’: Ethnographic Research on the Minimum Livelihood Guarantee,” The China Quarterly, Volume 202, pp. 20 - 37. Haglund, Dan (2009). “In It for the Long Term? Governance and Learning among Chinese Investors in Zambia's Copper Sector,” The China Quarterly, Volume 199, pp. 627 – 646.
Cont’d Jiang, Wenran (2009). “Fuelling the Dragon: China's Rise and Its Energy and Resources Extraction in Africa,” The China Quarterly, Volume 199, pp. 585 - 609. Li, Wanxin (2011). “Self-Motivated versus Forced Disclosure of Environmental Information in China: A Comparative Case Study of the Pilot Disclosure Programs,” The China Quarterly, Volume 206, pp. 331 – 351. Li, Yu-wai, Bo Miao and Graeme Lang (2011). “The Local Environmental State in China: A Study of County-Level Cities in Suzhou,” The China Quarterly, Volume 205, pp. 115 – 132. Mead, Robert W. and Victor Brajer (2008). “Environmental Cleanup and Health Gains from Beijing's Green Olympics,” The China Quarterly, Volume 194, pp. 275 - 293. Shen, J. (2006). “A simultaneous estimation of Environmental Kuznets Curve: Evidence from China,” China Economic Review, Volume 17, Issue 4, pp. 383-394.
Cont’d Stalley, Phillip and Dongning Yang (2006). “An Emerging Environmental Movement in China?” The China Quarterly, Volume 186, pp. 333 - 356. Stern, Rachel E. (2011). “From Dispute to Decision: Suing Polluters in China,” The China Quarterly, Volume 206, pp. 294 - 312. Sullivan, Jonathan and Lei Xie (2009). “Environmental Activism, Social Networks and the Internet,” The China Quarterly, Volume 198, pp. 422 - 432. Tong, Yanqi (2007). “Bureaucracy Meets the Environment: Elite Perceptions in Six Chinese Cities,” The China Quarterly, Volume 189, pp. 100 - 121. Zhang, Tao (2010). ”Environmental Performance Assessment of China's Manufacturing,” Asian Economic Journal, Volume 24, Issue 1, pp. 45–68.