Download
1 / 17
170 likes | 176 Views
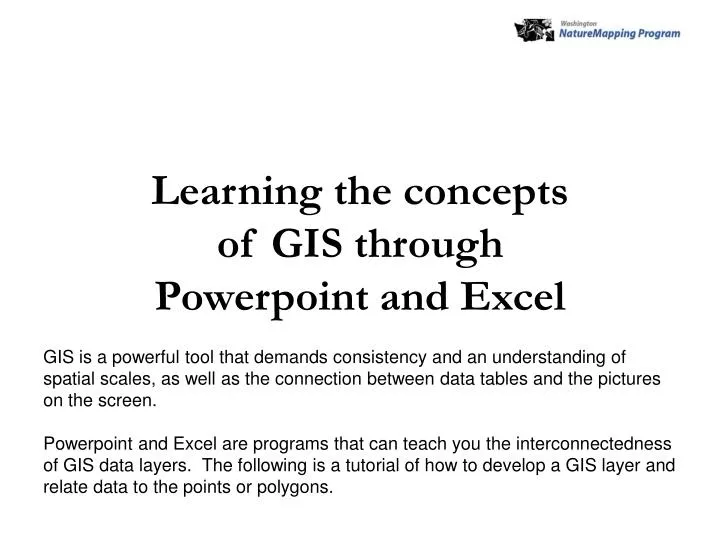
Learning the concepts of GIS through Powerpoint and Excel. GIS is a powerful tool that demands consistency and an understanding of spatial scales, as well as the connection between data tables and the pictures on the screen.

E N D
Learning the concepts of GIS through Powerpoint and Excel GIS is a powerful tool that demands consistency and an understanding of spatial scales, as well as the connection between data tables and the pictures on the screen. Powerpoint and Excel are programs that can teach you the interconnectedness of GIS data layers. The following is a tutorial of how to develop a GIS layer and relate data to the points or polygons.
The Tacoma Nature Center Snake Lake Wetland Complex This is an aerial photo of The Tacoma Nature Center provided by NatureMapping. Insert a picture and size it to your slide. Make a Duplicate slide and begin work in that slide (#2)
Wetland Monitoring Sites 1 2 3 4 Slide #2 Using the Draw Menu, select circles and place the circles where the monitoring sites occur Number the sites using the Text box and fill Make a Duplicate slide and go to Slide #3 5
Wetland Monitoring Sites 1 2 3 4 Slide #3 Delete the aerial photo so just the points and locations remain Make a duplicate slide 5
Wetland Monitoring Sites Slide #4 Delete the location numbers so just the points remain
7 Developed Area Monitoring Sites 8 6 9 10 Slide #5 Repeat the process used for slides #1-4
7 Developed Area Monitoring Sites 8 6 9 10
Upland Forest Monitoring Sites 11 12 13 14 Repeat the process used for slides #1-4 15
Upland Forest Monitoring Sites 11 12 13 14 15
Habitats Legend: Developed Wetland Upland Forest Select AutoShapes, then Lines, and then the icon that shows a polygon. Begin drawing your monitoring habitat and double click to close the line. It may automatically fill in with a color and change color fill to “none” Draw each of the habitats and create a Legend
Habitats Legend: Developed Wetland Upland Forest Make a duplicate slide and delete the aerial photo
Tacoma Nature Center Habitats and Monitoring Sites Legend: Developed Wetland Upland Forest Make another duplicate slide of the habitats and aerial photo. Go to each slide that has just the points and from the File Menu, Select All (the text will also be selected) or hold the Shift Key down and highlight each point. From the File Menu, Select Copy and then go to this slide and Paste. Repeat for all points
Tacoma Nature Center Habitats and Monitoring Sites 7 8 6 9 Legend: Developed Wetland Upland Forest 10 1 2 11 12 3 4 13 Repeat the process from the previous slide and add the location numbers. You have now created a point and polygon GIS map. 14 5 15
Creating a Spreadsheet (Table) that corresponds (relates) with your monitoring sites
1 2 3 4 5 Develop a Data Collection Form or use the NatureMapping Data Collection Form Replace Column B title with “Site” and place your Site numbers in there. Data can be sorted by Site number. This table can be imported into GIS when you are ready to use GIS software.