Download
1 / 28
280 likes | 470 Views
Measuring Efficiency & Effectiveness in HHW/CESQG Collection Programs. Jim Quinn Metro Hazardous Waste Program Portland, OR PSI/NAHMMA Conference June 2009. Presentation Overview. Basic program measures Measuring efficiency Measuring effectiveness Is there anything else?

E N D
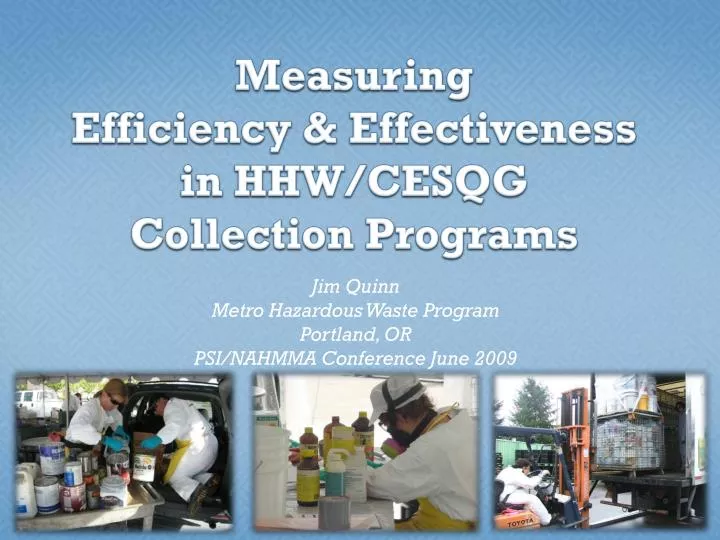
MeasuringEfficiency & Effectivenessin HHW/CESQG Collection Programs Jim QuinnMetro Hazardous Waste Program Portland, ORPSI/NAHMMA Conference June 2009
Presentation Overview • Basic program measures • Measuring efficiency • Measuring effectiveness • Is there anything else? • 2005 program comparison study
Metro’s collection program:(FY07-08 numbers) • 2 permanent collection facilities Metro South: 28,600 household customers Metro Central: 19,215 household customers • Roundup program 12,296 customers • CESQG program 788 customers • MetroPaint • Total waste handled: 5.5 million pounds
Basic program measures • Customers served • Pounds collected • Program cost • Labor hours (FTE)
Composite measures • Pounds/customer • Cost/customer • Cost/pound • Labor hours/customer • Pounds/labor hour
Cost Three components: • Labor • Materials • Disposal But what about: • Capital costs • “Overhead”- maintenance, utilities, etc. • Promotion & education • Supervisor, managers, safety staff, support staff • HR, IT, accounting, payroll
Customers • Are repeat customers tracked? • What about a customer bringing in waste from multiple households? Waste volume • Do you include container weights, drum weights, etc., or do you determine net weight? • Do you use weight assumptions and averages?
Efficiency- cost per pound Metro, FY07-08 data Total operating cost: $3,636,332 Revenue: $133,700 Net operating cost: $3,502,632 Total pounds handled = 4,762,000 Net cost per pound: $0.73
Efficiency- cost per pound Comparing across programs- more caveats: • Differences in the wastes handled? • Proportion of less expensive waste, e.g. oil, antifreeze, lead-acid batteries • More expensive wastes- explosives, reactives, gas cylinders, etc.
Wastes- Metro’s Program • Latex Paint 42% • Oil-based paint & other flammables 26% • Motor Oil, Car Batteries, Antifreeze 9% • Pesticides 6% • Cleaners & water-based wastes 3% • Aerosols 3% • Acids, bases and oxidizers 2% • Miscellaneous 9%
“Miscellaneous” • Batteries • Asbestos • Propane and other compressed gas cylinders • Reactives & organic peroxides • Ammunition/explosives • Radioactives • Sharps • PCB-containing fluorescent ballasts
Efficiency- pounds handled per labor hour Total FTE = 28.25 = 58,760 hours Total pounds handled = 4,762,000 Pounds handled per hour = 81
Efficiency- pounds handled per labor hour 48% increase
Effectiveness ?????
Effectiveness • % of all HHW generated that is collected • % of households served per year • pounds collected per capita Useful only by comparison to other HHW programs
Effectiveness What is the goal of the program? Metro’s goal: “Reduce the use and improper disposal of products generating hazardous waste in order to protect the environment and human health.”
Improper disposal- impacts on health and the environment • In the home- poisonings, fires, indoor air quality • The solid waste system- workers, equipment • Sewer system, wastewater treatment plants • Air, ozone layer, surface water, ground water • Plants & animals
Other program considerations • What about: • Customer service • Worker safety • Environmental impact of disposal methods selected • Other services provided by program
Other services provided by Metro staff • Emergency response to hazardous materials incidents at Metro’s transfer stations • Response to loads setting off transfer station radiation alarms • Disposal of various Metro facilities’ waste (Zoo, Parks, etc.) • School chemical cleanouts • Abandoned waste • Education
2005 Comparison Study • Compared Metro’s program to 24 other leading HHW programs • Findings: • Metro provides greater convenience and hours of operation than other programs • Metro handles “difficult” wastes that others do not (asbestos, explosives, radioactives, and gas cylinders)
2005 Comparison Study (cont.) Primary benchmark for comparison across programs - cost per pound • Range:$0.21 to $2.02 • Median:$0.67 • Metro’s cost per pound: $0.85 (FY07-08 down to $0.73) • but- 19 of the 24 other programs handle larger % of inexpensive auto-related wastes (oil, antifreeze & lead-acid batteries), typical cost < $0.10/pound
2005 Comparison Study (cont.) • % of the households in the region served each year • range: 2%- 24% • median: 7% • Metro: 10% • pounds collected per capita • range: 0.81- 6.55 • median: 2.30 • Metro: 2.93