Download
1 / 72
720 likes | 908 Views
CIVL 4990 F inal Year Project (F.Y.P.) - Guide for Good Technical Communication. The Technical Writing Process – General Principles Civil Engineering Writing: Research Report: the Final Year Project (F.Y.P.): Title Abstract Introduction, Literature Review Methods - Procedures

E N D
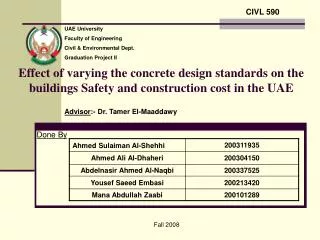
CIVL 4990 Final Year Project (F.Y.P.) - Guide for Good Technical Communication
The Technical Writing Process – General Principles Civil Engineering Writing: Research Report: the Final Year Project (F.Y.P.): Title Abstract Introduction, Literature Review Methods - Procedures Results Recommendations References Language check: Coherence Verb Tense Active/Passive Voice Contents: CIVL 4990, Seminar 1
General Principles Define the “rhetorical situation”: Identify your document's subject purpose readers and contextof use
What is the subject(topic)? • Who are myreaders, and what do they want and need? • When will the information be used, and when is it needed? (context) • Why do the readersneed the information in this document? (context) Ask some “5 W and 1 H” questions:Who? What? When? Where? Why? How? • General Principles
Where do they need the information, and • Where will they use it? (context) • How should I achieve my purposewith this subject? • How “big” is my subject and project? • How do I choose my focus? • General Principles
Your document's purpose is probably the most important element of the four elements. • It is what you want to research and achieve. • Right at the very beginning, write a temporary draft Statement of Purpose • to guide your research. • General Principles
This should be only one or two sentences, (often called a thesis statement -- as in “hypothesis”). This statement guides your research and drafting, and keeps your writing on the one subject (topic). In your final draft, no other information is needed. Extra info should be cut. General Principles
acts like a compass for the document. It guides you. Your developing ideas stay on the one same (subject), and the parts are then related to the whole. The Statement of Purpose General Principles
Find an appropriate action verb. Then build your Statement of Purpose around it. General Principles
Information: • to inform • to describe • to define • to review • to notify • to instruct • to explain • to demonstrate Persuasion: • to convince • to influence • to recommend • to advocate • to defend • to justify • to support • to argue action verb examples for the purposes of: 10
Link to: Purdue University's Online Writing Lab: Engineering Reports 2. Final Year Project (F.Y.P.) Report
The F.Y.P. Report is a detailed discussion of your work forreaders who want to know in some depth and completeness • the background of what was done (subject) • how it was done (Methods) • what the Resultswere, and • Conclusionsand Recommendations
Decide on the general subject of your F.Y.P. research, then manageinformation you collect, sorting through texts, scraps and research data to uncover what you need. Your writing should give your primary readers (for F.Y.P., your Advisor and 2nd Reader) only the information they require. F.Y.P. Report
Two processes at the same time: • organizing content - shaping your ideas into a document that will be clear to readers • drafting content - generating the content of your document by including facts, data, reasoning, and examples Organizing and Drafting F.Y.P. Report
Organizing and Drafting Even during research, you can easily know how to organize and connect the information you collect in a way that achieves your writing purpose if you follow and mostly stay with the requirements of a kind of writing, such as • explanation • description • process analysis (the “story”), or • argument F.Y.P. Report
For example, the text on the next page is recognizable as a set of instructions because it follows the requirements of language and layout on the page of that kind of writing. F.Y.P. Report
How to Brush Your Teeth: First, put your toothbrush under water to get it wet. Then, open the toothpaste tube. Squeeze a strip of toothpaste onto the brush. Rub the toothbrush rapidly up, down and around your teeth, gums, and the top of your mouth. Rinse with water. Finally, gargle with Listerine. F.Y.P. Report
The Title • introduces the subject of discussion to the audience, so it should state the subject • generates the reader’s interest in the report. F.Y.P. Report: Title
The Abstract is a summary of the purpose (“Thesis” statement), Methods, and Results. For example: F.Y.P. Report: Abstract
A good Abstract must answer • What are the main, essential ideas? • Who is the research intended for – the readers? • What is the significance for industry or the field of research? F.Y.P. Report: Abstract
from a 2012-13 F.Y.P. Report abstract : “Construction delays are common in civil engineering projects in Hong Kong, inevitably resulting in contractual claims and increased project cost. This study was aimed, first, at gathering the perceptions of civil construction practitioners on how significant are the causes of delay; a poorabstract example:Construction Delays in Hong Kong F.Y.P. Report: Abstract
“and, second, investigating whether the suggestions as stated in the report of the Construction Industry Review Committee, which comprises members with good standing and knowledge in the construction and related fields as well as those from other professions who are responsible for examining the current state of the construction industry in terms of its output quantity, the quality of work, Construction Delays in Hong Kong (p.2) F.Y.P. Abstract
“its environmental friendliness, site safety, its workforce and the system of supervision, are applicable to and effective at mitigating the corresponding delays with reference to a ranking order established using the mean score method. The extent of the differences in perception among the different respondent groups on these two issues was also examined . . .” Construction Delays in Hong Kong (p. 3) F.Y.P. Abstract
What are the essential ideas in this Abstract? (in goldletters here below) “Construction delays are common in civil engineering projects in Hong Kong, inevitably resulting in contractual claims and increased project cost. This study was aimed, first, at gathering the perceptions of civil construction practitioners on how significant are the causes of delay; and, second, investigating whether the suggestions as stated in the report of the Construction Industry Review Committee, . . . F.Y.P. Abstract
“. . . which comprises members with good standing and knowledge in the construction and related fields as well as those from other professions who are responsible for examining the current state of the construction industry in terms of its output quantity, the quality of work, its environmental friendliness, site safety, its workforce and the system of supervision, are applicable to and effective at mitigating the corresponding delays with reference to a ranking order established using the mean score method. The extent of the differences in perception among the different respondent groups on these two issues was also examined . . .. F.Y.P. Abstract
Version 2 -- after re-write “This study first gathered the perceptions of civil construction practitioners on the significance of causes of delay, and second, using a ranking order, mean score method, investigated whether suggestions of the Report of the Construction Industry ReviewCommittee are effective at mitigating delays.” F.Y.P. Abstract
The Introduction • acquaints thereader with the subject and purpose of the paper • generates the reader’s interest in the topic • offers background information (usually) that the reader needs to know to understand the report and its importance – the Literature Review
presents • the problem and its significance, • the technical goals of the work, and • a plan for the following presentation and discussion – a general overview of what is to come in the report The Introduction 2012 - 2013 Beginning F.Y.P. Purpose Statements (with tutor's notes) F.Y.P.Introduction
Consider who your main target reader is and what background knowledge they have. • Information needed by someone specializing in structures might be very different from someone working with electronics applications (context of use) F.Y.P. Introduction • Introduction marking criteria: • at The Excellent Engineer blog site
Two different versions of organisationof an Introduction. You can see that six elements (labeled in blue on the left side) are arranged in different orders. Your order depends on your subject and purpose.
In your review of other research when presenting the background of your subject, use tenses carefully. • Pastresearch should be described in past tenses. • Facts which are always or generally true use presenttense verbs. • (Tenses are discussed more in the Language Check section of this slideshow, slides 64-67.) Introduction: Literature Review F.Y.P. Introduction: Literature Review
describes the major pieces of equipment used, or new methodologies developed • lists essential steps of what was done • gives a complete account of the procedures and assumptions and limitations Methods Marking Criteria: on The Excellent Engineer blog site Methods/Procedures
In this section, you • present and explain the data or the end product of the study, test, or project • can include tables charts and/or graphs • analyze uncertainties • note significant trends Results
compare evidence with hypotheses • evaluate limitations or the chance for faulty interpretation • discuss assumptions • describe how your research could be repeated • be specific and precise • avoid vague statements Results
Use graphics instead of text when they easily and effectively convey information. • Example: a floor plan is more efficient for describing the structure of a building than a text description. • Use graphics when they need less space than equivalent textual information. • Example: the description of a procedure may be much longer than an equivalent diagram. • Do not decorate the writing just because you think it “looks nice”. Graphics: when to use them Results: Graphics
Different kinds of graphics can tell different “stories”. What do you want to tell? To decide which graphic is best for the data you want to display, first decide what “story” you want to tell. Then choose the type of graphic that tells the story.
This type of chart can be created with Microsoft Project,and can useful in planning and scheduling, especially if you are working with a team. Gantt Chart Results: Graphics
Proper labeling and placement of graphics help readers move back and forth between the main text and images. Each graphic should be labeled informatively. Results: Graphics
This chart compares the size of the immigrant workforce in Australia 1991 with that of 2001. In other words, it shows change over time. To describe charts with change over time, you need to use verb tenses correctly: Between 1991 and 2001, the population increased (simple past) By 2001, the population had increased (past perfect). Results: Graphics
Example: the following graph “tells the story” of Greenhouse Gases. Notice the tensesof the verbsin the text on the left. Results: Graphics
The chart shows changes in the atmos-pheric concentrations over the past 1000 years. The ice core data for several sites in Antarctica and Greenland (shown by different symbols) are supplemented with the data from direct atmospheric samples over the past few decades (shown by the line for CO2 and incorporatedin the curve, which representsthe global average of CH4). 2.e. Results: Graphics
The estimated positive radiative forcing of the climate system from these gases indicated on the right-hand scale. Concentrations reflect emissions from sources throughout the globe. All three records showeffects of the growth in anthropogenic emissions. Source: IPCC –UNEP Third Assessment Report "Climate Change 2001" Results: Graphics
interpretthe results -- the thinking about the implications of the results. • are often confused with results. • aregeneralizations about the problem that can reasonably be deduced from the results. Conclusions
avoid obvious statements • e.g. “X doesn’t work well under difficult conditions.” • consider how your conclusions will be received by your readers • as well as by “secondary readers” -- those to whom the report is not addressed, but who will still read and be influenced by your report. • whatis their situation (context)? • how they will understand your data? Conclusions Conclusions