Download
1 / 19
190 likes | 354 Views
Introduction to Statistics for the Scientific Discovery Program. Topic 1: Data and Variables. Overview. Statistics is the science of study design, data collection, summarizing and analyzing data, and interpretation of data. Examples of data:

E N D
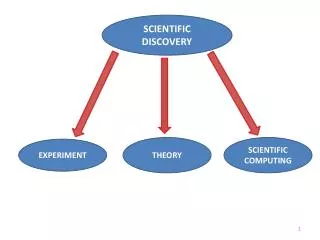
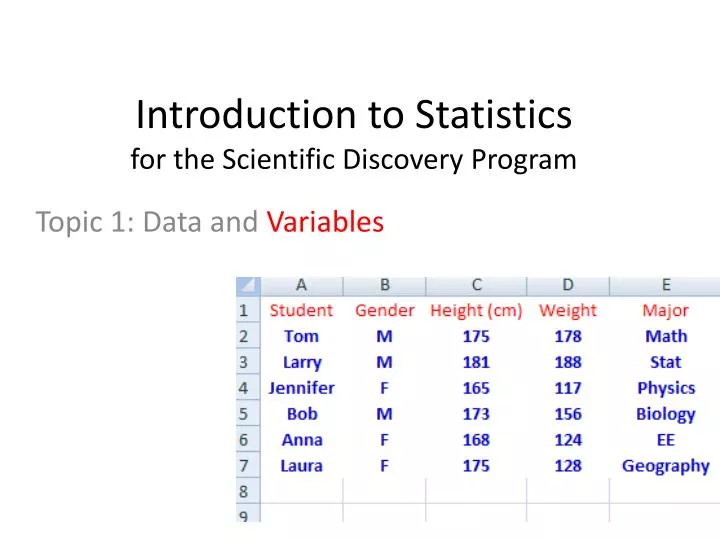
Introduction to Statistics for the Scientific Discovery Program Topic 1: Data andVariables
Overview Statistics is the science of study design, data collection, summarizing and analyzing data, and interpretation of data. Examples of data: http://www.nba.com/games/20090614/LALORL/boxscore.html 6 W’s: Why is the study important? (the purpose of the study) Who (called subject or observation) were measured on (questioned of) what characteristics. How was the study conducted (data collected)? When was the study conducted? Where? We may use statistics to simply describe data (shape, center, and dispersion/spead, relationship)- lectures ??? We may also use statistics to make inference about a population if good data are available from that population. –lectures??? Standard procedures are available for collecting good data. –Sampling techniques and experimental designs: Lectures ??? To plan a study using statistics, you need to ask: • What is the scientific question of interest? • What is the statistical question? • How can we design a good study to answer the question? (survey, experiment)
Good Data Sources • Observational study and experiment • In an observational study, subjects (human, animal, plant, or material) are solely observed and interest characteristics are recorded. An important special case is survey. Surveys are used to collect quantitative information about a study population. Surveyees should be selected at random and are representative of the underlying population. Other special cases are case-control study, cohort study and cross-sectional study. • Experiments are studies in which subjects are randomly assigned to treatments (drug, teaching methods, or other interventions) in order to compare these treatments. A good experiment should involve a control. • A collection of subjects selected at random is called a sample. • The bigger collection from which a sample is selected is called a population.
Survey What is your gender? Which of the following terms best describe yours your political views: liberal, moderate, or conservative? Do you agree with the statement “ Activities of married women are best confined to home and family?” Do you think that the United States should retain or abolish the penny as a coin of currency? Rank your opinion of the value of statistics in society on a numerical scale of 1 (completely useless) to 9 (incredibly important). Do you favor gasoline tax? Do you favor gasoline tax to reduce U.S. dependence on foreign oil? (better) More survey questions: http://www.surveyshare.com/surveytemplate/templateclstudentsurvey.html Difference between a Poll and a Survey? A poll allows you to ask one question with a choice of answers. A survey allows you to ask multiple questions across a wider range of question types. So you can ask for a comment, an email address, their name, their address etc..
Case-control Study • In a case-control study, one starts with samples of subjects who do and who do not have the disease and then looks back into their histories to see which have exposed and which have not exposed to a certain condition (i.e., smoking). • Example: A researcher conducts a study by taking a random sample of 500 lung cancer patients and a random sample of 500 people who do not suffer from lung cancer and then comparing the proportions of smokers in each group.
Cohort Study • In a cohort study, one starts with samples of subjects who do and who do not use a certain treatment (or expose to a condition) and then follows them into the future to see which do and which do not develop the disease. • Example: A researcher conducts a study by taking a random sample of 500 smokers and a random sample of 500 nonsmokers, following them for 20 years, and then comparing the proportions of people who develop lung cancer in each group.
Cross-Sectional Study • In a cross-sectional study, one simply takes a sample of subjects and classifies them according to one or more variables. • Example: A researcher conducts a study by taking a random sample of 1000 people from a population and recording the smoking status and disease status (whether or not has lung cancer).
Experiment Examples: To study whether an SAT coaching program helps students score higher on the SAT’s, randomly assign 50 students from 100 available ones to attend the program and the remaining 50 to the control group. Because of randomization, the two groups are similar in any characteristic (age, IQ, major, GPA, …) except for the program. Any difference between the two group average scores can be attributed to the coaching program. There are two variables involved here: group and SAT score. The effect of the group is what we wish to study, so the group variable is called the explanatory variable, while the SAT score variable will be affected by the group variable and thus is called the response variable.
Designing Experiments • Experiment is the best type of research to assess cause and effect. • Jargons: • Subjects- individuals studied in an experiment • Factors- a controlled explanatory variable whose levels are set by the experimenter. • Treatments- specific experimental conditions applied to the subjects; if an experiment has more than one factors, a treatment is a combination of specific values of each factor. • The three basic principles of experimental design are • Control - Control the effects of lurking variables on the response. There are two forms of control: comparison and blocking. Uncontrolled experiments yield worthless results because of confounding with lurking variables. • Randomization- assign subjects to the treatments by chance. Using randomization is the most reliable method of creating homogeneous treatment groups, without involving any potential biases. • Replication- Allocate two or more subjects to a treatment (to reduce chance variation).
Completely Randomized Designs In a completely randomized design (CRD), all the subjects are allocated at random among all the treatments.
Matched Pairs and Block Designs A matched pairs design compares exactly two treatments, either by using a series of individuals that are closely matched two by two or by using each individual twice. A block design is an extension to matched pairs designs. A block is a group of individuals that are known to be similar in some way that is expected to affect the response to the treatments. In a block design, the random assignment of individuals to treatments is carried out separately within each block.
Example: Can Changing the Diet Reduce High Blood Pressure (HBP)? • Vegetarian diets and low-salt diets are both promising. Men with HBP are assigned at random to four diets: (1) normal diet with unrestricted salt; (2) vegetarian with unrestricted salt; (3) normal with restricted salt; and (4) vegetarian with restricted salt. Answer the following questions: • How many factors are involved? • Which of the following could be the response variable? (1) the amount of salt in the subject’s diet (2) which of the four diets a subject is assigned to (3) change in blood pressure after 8 weeks on the assigned diet • 240 volunteers are available and are labeled 001 to 240. Software assigns an SRS of 60 subjects to Diet 1, then an SRS of 60 of the remaining 180 to Diet 2, then an SRS of 60 of the remaining 120 to Diet 3. The 60 who are left get Diet 4. This is a CRD, block design with four blocks, or matched pairs design? • The FDA should be reluctant to use the results of the experiment described above for its guideline on diets for Americans with HBP because results from men with HBP may not generalize to the population of all Americans with HBP.
Example: The Community The Community Intervention Trial for Smoking Cessation asked whether a community-wide advertising campaign would reduce smoking. The researchers located 11 pairs of communities for which the members of each pair were similar in location, size, economic status, and so on. One community in each pair participated in the advertising campaign and the other did not. Is this an observation study, matched pairs experiment, or a CRD? To decide which community in each pair should get the advertising campaign, it is best to toss a coin.
Example: In an experiment to determine if a new type of fertilizer is better than the current "standard" fertilizer for growing corn, twenty plots of land are randomly assigned one of the two types. At the end of the growing season, the corn yields for each plot are measured. It was found that plots which were located closer to a highway had smaller yields than other plots. In this experiment, distance from the highway is a A. lurking variable.B. response variable.C. factor.
Example (cont’d): The following year, the experiment was redone, but the plots were randomly assigned to either the new or old fertilizer according to the distance from the highway. The new experiment was A. completely randomized.B. blocked.C. matched pairs.
Example: In an experiment on a new drug, subjects were randomly assigned to either a placebo or the active drug. In addition, the method of delivery of the drug (pill, skin patch, or nasal mist) was considered. In this experiment, there were how many factors? A. 1B. 2C. 3 There were how many treatments? A. 4B. 2C. 12
Example: Is drinking strong coffee more efficient in lowering blood alcohol content (BAC) than simply waiting after alcohol consumption? 30 subjects , 18 men and 12 women, agree to drink alcohol until their BAC reaches 0.08. The treatment is applied at that point, and the BAC is measured two hours later. (a) Describe the design of a completely randomized comparative experiment to learn the effect of drinking coffee on BAC. (b) Describe the design of a matched pairs experiment using the same 30 subjects. (c) Describe the design of a block experiment considering men and women separately.
Double-blind Experiments In order to remove the so-called placebo effect, in a double-blind experiment, neither the subjects nor the investigator know which treatment each subject is receiving.
Classification of Data • Data refers to any quantitative or qualitative description of subjects in some specific context. • Data usually are quantitative (with units), such as the values of heights, weights, incomes, blood pressure, tumor counts, etc. • Data in surveys often are qualitative, such as the value of race, gender, education, course grade, etc. • Data that are quantitative can be continuous or discrete • Data that are qualitative can be ordinal: education, course grade • Data are named by variables, so we may say a variable is quantitative or qualitative.