Download
1 / 1
20 likes | 172 Views
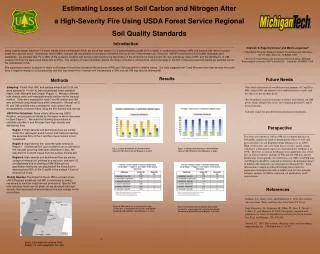
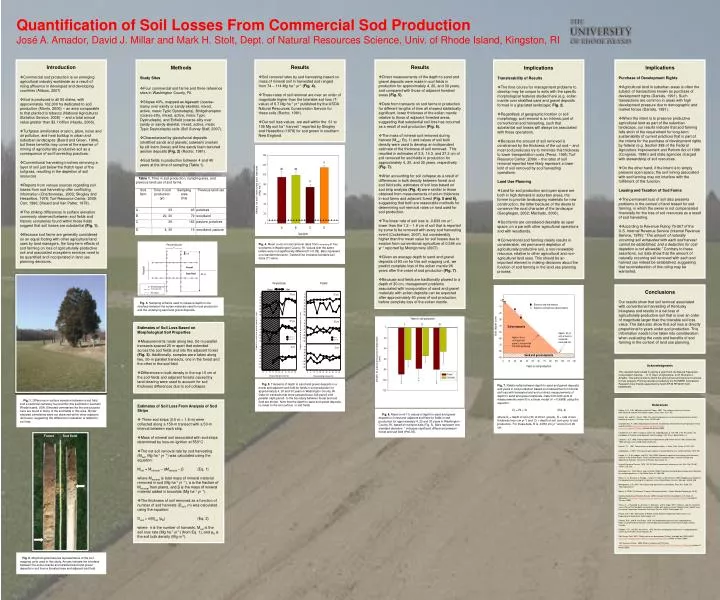
Perpendicular. 5 m. Forest. Sod field. Forest. Sod field. 50 m. Sampling point. Transect line. Boundary. Quantification of Soil Losses From Commercial Sod Production

E N D
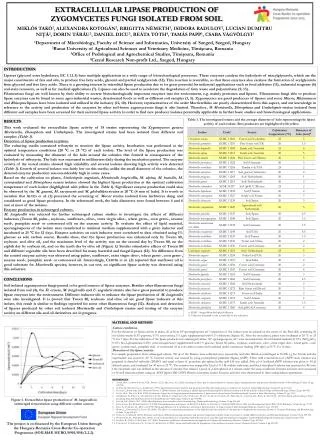
Perpendicular 5 m Forest Sod field Forest Sod field 50 m Sampling point Transect line Boundary Quantification of Soil Losses From Commercial Sod Production José A. Amador, David J. Millar and Mark H. Stolt, Dept. of Natural Resources Science, Univ. of Rhode Island, Kingston, RI • Introduction • Commercial sod production is an emerging agricultural industry worldwide as a result of rising affluence in developed and developing countries (Aldous, 2007). • Sod is produced in all 50 states, with approximately 162,000 ha dedicated to sod production (Morris, 2006) – an area comparable to that planted to tobacco (National Agricultural Statistics Service, 2008) – and a total annual value greater than $3.1 billion (Haydu, 2006). • Turfgrass ameliorates erosion, glare, noise and air pollution, and heat buildup in urban and suburban landscapes (Beard and Green, 1994), but these benefits may come at the expense of mining of agriculturally productive soil as a consequence of sod harvesting practices. • Conventional harvesting involves removing a layer of soil just below the thatch layer of the turfgrass, resulting in the depletion of soil resources. • Reports from various sources regarding soil losses from sod harvesting offer conflicting information (Charbonneau, 2003; Skogley and Hesseltine, 1978; Turf Resource Center, 2009; Carr, 1996; Sheard and Van Patter, 1978). • The striking differences in surface elevation commonly observed between sod fields and historic cemeteries found within these fields suggest that soil losses are substantial (Fig. 1). • Because sod farms are generally considered on an equal footing with other agricultural land uses by land managers, the long-term effects of sod farming on loss of agriculturally-productive soil and associated ecosystem services need to be quantified and incorporated in land use planning decisions. • Methods • Study Sites • Four commercial sod farms and three reference sites in Washington County, RI. • Slopes ≤3%, mapped as Agawam (coarse-loamy over sandy or sandy-skeletal, mixed, active, mesic Typic Dystrudepts), Bridgehampton (coarse-silty, mixed, active, mesic Typic Dystrudepts), and Enfield (coarse-silty over sandy or sandy-skeletal, mixed, active, mesic Typic Dystrudepts) soils (Soil Survey Staff, 2007). • Characterized by glaciofluvial deposits (stratified sands and gravels; outwash) overlain by silt loam (loess) and fine sandy loam textured aeolian deposits (Fig. 2) (Rector, 1981). • Sod fields in production between 4 and 40 years at the time of sampling (Table 1). • Results • Soil removal rates by sod harvesting based on mass of mineral soil in harvested sod ranged from 74 – 114 Mg ha-1 yr-1(Fig. 4). • These rates of soil removal are over an order of magnitude higher than the tolerable soil loss (T-value) of 6.7 Mg ha-1 yr-1 published by the USDA Natural Resources Conservation Service for these soils (Rector, 1981). • Our soil loss values are well within the 61 to 105 Mg soil ha-1 harvest-1 reported by Skogley and Hesseltine (1978) for sod grown in southern New England. • Results • Direct measurements of the depth to sand and gravel deposits were made in sod fields in production for approximately 4, 20, and 30 years, and compared with those of adjacent forested areas (Fig. 5). • Data from transects on sod farms in production for different lengths of time all showed statistically significant, lower thickness of the eolian mantle relative to those of adjacent forested areas, suggesting that substantial soil loss has occurred as a result of sod production (Fig. 6). • The mass of mineral soil removed during harvest (Mnet; Eq. 1) and values of soil bulk density were used to develop an independent estimate of the thickness of soil removed. This resulted in estimates of 2.8, 14.3, and 27.2 cm of soil removed for sod fields in production for approximately 4, 20, and 30 years, respectively (Fig. 7). • After accounting for soil collapse as a result of differences in bulk density between forest and sod field soils, estimates of soil loss based on sod strip analysis (Fig. 4) were similar to those obtained from measurements of solum thickness in sod farms and adjacent forest (Fig. 5 and 6), suggesting that both are reasonable methods for determining soil removal rates on land used for sod production. • The linear rate of soil loss is -0.833 cm yr-1, lower than the 1.2 – 1.6 cm of soil that is reported by some to be removed with every sod harvesting event (Cockerham, 2007), but considerably higher than the mean value for soil losses due to erosion from conventional agriculture of 0.394 cm yr-1 reported by Montgomery (2007). • Given an average depth to sand and gravel deposits of 83 cm for this soil mapping unit, we predict complete loss of the eolian mantle 96 years after the onset of sod production (Fig. 7). • Because sod fields are traditionally plowed to a depth of 30 cm, management problems associated with incorporation of sand and gravel materials with eolian deposits can be expected after approximately 60 years of sod production, before complete loss of the eolian mantle. • Implications • Transferability of Results • The time course for management problems to develop may be unique to soils with the specific morphological features studied here (e.g. eolian mantle over stratified sand and gravel deposits formed in a glaciated landscape; Fig. 2). • Regardless of geographic location or soil morphology, soil removal is an intrinsic part of conventional sod harvesting, such that substantial soil losses will always be associated with these operations. • Because the amount of soil removed is constrained by the thickness of the cut sod – and most sod producers try to minimize this thickness to lower transportation costs (Perez, 1995; Turf Resource Center, 2009) – the rates of soil removal reported here likely represent a lower limit of soil removed by sod harvesting operations. • Land Use Planning • Land for sod production and open space are both in high demand in suburban areas, the former to provide landscaping materials for new construction, the latter because of the desire to conserve the rural character of the landscape (Geoghegan, 2002; Machado, 2006). • Sod farms are considered desirable as open space, on a par with other agricultural operations and with woodlands. • Conventional sod farming clearly results in considerable, net permanent depletion of agriculturally-productive soil, a non-renewable resource, relative to other agricultural and non-agricultural land uses. This should be an important element in making decisions about the function of sod farming in the land use planning process. • Implications • Purchase of Development Rights • Agricultural land in suburban areas is often the subject of transactions known as purchase of development rights (Daniels, 1991). Such transactions are common in areas with high development pressure due to demographic and market forces (Daniels, 1991). • When the intent is to preserve productive agricultural land as part of the suburban landscape, our results indicate that sod farming falls short of the requirement for long-term sustainability of current practices that is part of the criteria for the purchase of development rights by federal (e.g. Section 388 of the Federal Agriculture Improvement and Reform Act of 1996 (Congress, 1996)) and state agencies charged with stewardship of soil resources. • On the other hand, if the intent is to simply preserve open space, the soil mining associated with sod farming may not interfere with the fulfillment of this function. • Leasing and Taxation of Sod Farms • The permanent loss of soil also presents problems in the context of land leased for sod farming, in which the owner is not compensated financially for the loss of soil resources as a result of sod harvesting. • According to Revenue Ruling 79-267 of the U.S. Internal Revenue Service (Internal Revenue Service, 1979): “The amount of naturally occurring soil exhausted with each sod harvest cannot be established, and a deduction for cost depletion is not allowable.” Contrary to these assertions, our data show that the amount of naturally occurring soil removed with each sod harvest can indeed be established, suggesting that reconsideration of this ruling may be warranted. Fig. 5. Transects of depth to sand and gravel deposits in a forest and adjacent sod field for fields in sod production for approximately 4, 20 and 30 years in Washington County, RI. Data for transects that were perpendicular (left panel) and parallel (right panel) to the boundary between forest and sod field are shown. Note that the depth to sand and gravel deposits is closer to the soil surface in sod fields. Fig. 6. Mean (n=9-11) values of depth to sand and gravel deposits in forest and adjacent sod field for fields in sod production for approximately 4, 20 and 30 years in Washington County, RI, based on transect data (Fig. 5). Bars represent one standard deviation. * indicates significant difference between forest and sod field (P≤0.05). Fig. 7. Relationship between depth to sand and gravel deposits and years in sod production based on measurement of mineral soil loss with harvested sod and on direct measurements of depth to sand and gravel materials. Data from both sets of measurements were fit to a linear model (r2 = 0.9868) using the equation: Dt = Rt + Di (Eq. 4) where Dt= depth of soil (cm) at time t (years), R= rate of soil thickness loss (cm yr-1) and Di = depth of soil (cm) prior to sod production. For these data, R is -0.833 cm yr-1 and Di is 0.09 cm. Parallel Fig. 3. Sampling scheme used to measure depth to the interface between the eolian materials used for sod production and the underlying sand and gravel deposits. Conclusions Our results show that soil removal associated with conventional harvesting of Kentucky bluegrass sod results in a net loss of agriculturally-productive soil that is over an order of magnitude larger than the tolerable soil loss value. The data also show that soil loss is directly proportional to years under sod production. This information needs to be taken into consideration when evaluating the costs and benefits of sod farming in the context of land use planning. Fig. 4. Mean (n=9) net soil removal rates from harvesting in four sod farms in Washington County, RI. Values with the same letters were not significantly different (P ≤ 0.05). Bars represent one standard deviation. Dashed line indicates tolerable soil sloss (T) value. • Estimates of Soil Loss Based on Morphological Soil Properties • Measurements made along two, 50-m parallel transects spaced 20 m apart that extended across the sod fields and into the adjacent forest (Fig. 3). Additionally, samples were taken along two, 50-m parallel transects, one in the forest and the other in the sod field. • Differences in bulk density in the top 10 cm of the sod fields and adjacent forests caused by land clearing were used to account for soil thickness differences due to soil collapse. Acknowledgments This research was funded in part by a grant from the Natural Resources Conservation Service, U. S. Dept. of Agriculture, to M. Stolt and J. Amador. The authors wish to thank the anonymous land owners for access to their property. Printing services provided by the RI-INBRE Centralized Research Core Facility supported by Grant # P20 RR16457 from NCRR/NIH. Fig. 2. Morphological features representative of the soil mapping units used in this study. Arrows indicate the interface between the eolian mantle and stratified sand and gravel deposits in soil from a forested area and adjacent sod field. References Aldous, D.E., K.W. McAuliffe, and N.M. Power. 2007. The turfgrass industry: Australia, New Zealand, and the Asia-Pacific region. Chron. Hort. 47:17-19. Beard, J.B., and R.L. Green. 1994. The role of turfgrasses in environmental protection and their benefits to humans. J. Environ. Qual. 23:452-460. Charbonneau, P. 2003. Sod production [Online]. Available by Ontario Ministry of Agriculture, Food and Rural Affairs www.omafra.gov.on.ca/english/crops/ facts/info_sodprod.htm#loss (verified 29 January 2009). Cockerham, S.T. 2007. Turfgrass culture for sod production, p. 139-150, In M. Pessarakli, ed. Handbook of Turfgrass Management and Physiology. CRC Press, Boca Raton, FL Congress, U.S. 1996. Federal Agriculture Improvement and Reform Act of 1996, Section 388, 105th Congress ed, United States of America. Daniels, T.L. 1991. The purchase of development rights. J. Amer. Plan. Assoc. 57:421-431. Geoghegan, J. 2002. The value of open spaces in residential land use. Land Use Policy 19:91-98. Haydu, J.J., A.W. Hodges, and C.R. Hall. 2006. Economic impacts of the turfgrass and lawncare industry in the United States. Food and Resource Economics Dept., Institute of Food and Agricultural Sciences, University of Florida, Gainesville, FL. Internal Revenue Service. 1979. 142.181 Soil removed with sod harvest, Vol. Rev. Rul. 79-267, 1979-2 C.B. 243. Machado, E.A., D.M. Stoms, and J. Kreitler. 2006. Prioritizing farmland preservation cost-effectively for multiple objectives. J. Soil Water Cons. 61:250-258. Milesi, C., S. Running, C. Elvidge, J. Dietz, B. Tuttle, and R. Nemani. 2005. Mapping and modeling the biogeochemical cycling of turf grasses in the United States. Environ. Manage. 36:426-438. Montgomery, D.R. 2007. Soil erosion and agricultural sustainability. Proc. Nat. Acad. Sci. 104:13268-13272. Morris, K. 2006. The National Turfgrass Research Initiative - Green Section Record, pp. 26-30. National Agricultural Statistics Service. 2008. Acreage [Online]. Available by U.S. Dept. of Agriculture http://usda.mannlib.cornell.edu/usda/current/Acre/Acre-06-30-2008.pdf (verified 29 January 2009). Perez, A., J. Harwood, D. Johnson, A. Somwaru, and G. Zepp. 1995. Turfgrass sod: An economic assessment of the feasibility of providing multiple-peril crop insurance. Report to the Federal Crop Insurance Corporation. Economic Research Service, USDA, Washington, DC. Rector, D.D. 1981. Soil Survey of Rhode Island. National Cooperative Soil Survey, U.S. Department of Agriculture, Washington, D.C. Sheard, R.W., and M. Van Patter. 1978. Soil modification during nursery sod production. Dept. of Land Resource Science, Ontario Agricultural College, University of Guelph, Ontario, Canada. Skogley, C.R., and B.B. Hesseltine. 1978. Soil loss and organic matter return in sod production. University of Rhode Island, Kingston, RI. Soil Survey Staff. 2007. Official soil series descriptions [Online]. Available by USDA-NRCS http://soils.usda.gov/technical/classification/osd/index.html (verified 12 March 2007). Turf Resource Center. 2009. What is turfgrass sod? [Online] www.turfgrasssod.org/webarticles/articlefiles/172-What%20Is%20Turfgrass%20Sod.pdf (verified 17 March 2009). • Estimates of Soil Loss From Analysis of Sod Strips • Three sod strips (0.5 m 1.8 m) were collected along a 150-m transect with a 50-m interval between each strip. • Mass of mineral soil associated with sod strips determined by loss-on-ignition at 550°C . • The net soil removal rate by sod harvesting (Mnet, Mg ha-1 yr -1) was calculated using the equation: • Mnet = Mmineral – αMmineral – β (Eq. 1) • where Mmineral is total mass of mineral material removed in sod (Mg ha-1 yr -1), α is the fraction of Mmineral from plants, and β is the mass of mineral material added in biosolids (Mg ha-1 yr -1). • The thickness of soil removed as a function of number of sod harvests (Dsoil, m) was calculated using the equation: • Dsoil = n(Mnet /ρB) (Eq. 2) • where n is the number of harvests, Mnet is the soil loss rate (Mg ha-1 yr-1) (from Eq. 1), and ρB is the soil bulk density (Mg m-3). Fig. 1. Difference in surface elevation between a sod field and a historical cemetery found within this sod field in southern Rhode Island, USA. Elevated cemeteries like the one pictured here are found in many of the sod fields in this area. Similar elevated cemeteries were not observed within other adjacent land uses, suggesting the difference in elevation is related to soil loss.