Download
1 / 17
170 likes | 271 Views
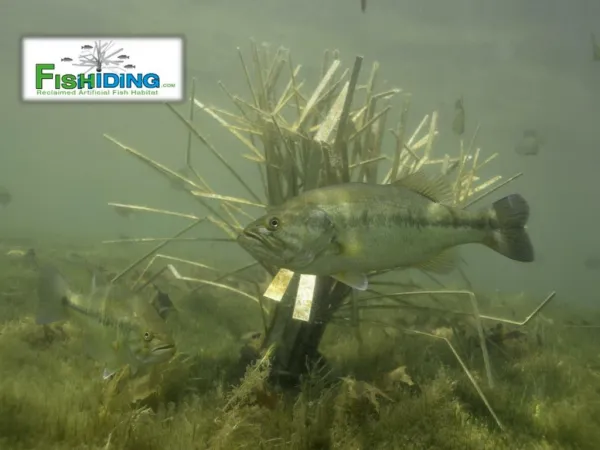
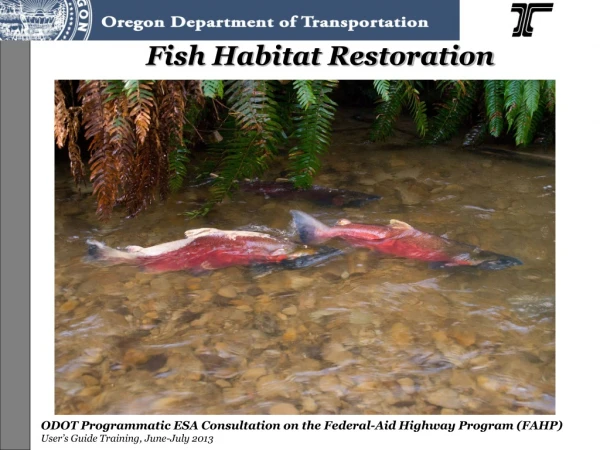
Sources of Fish Decline Habitat disruption. Breeding areas Larval development areas Bottom structure. Not all patterns are negative. Population processes: aid to intelligent management?. 1830’s – concerns about fluctuations in catch in North Sea Disbelief that humans could cause this

E N D
Sources of Fish DeclineHabitat disruption • Breeding areas • Larval development areas • Bottom structure
Population processes: aid to intelligent management? • 1830’s – concerns about fluctuations in catch in North Sea • Disbelief that humans could cause this • C. D. J. Petersen (Denmark) applied science • mark-recapture to estimate population size • collected data on age-dependent reproduction • applied population model to predict connection between fishing mortality & fish populations • Criticized as “irrational” (not “profitable”) • Tested during WW I and WW II
What do we need to know? • Demography: the study of processes affecting populations • Processes adding to populations: • births, immigration • Processes subtracting from populations: • death, emigration • Base number of individuals • Whether the processes are constant through time • could vary with season or other scales of time • could vary with the density of individuals, which change over time
What if processes are constant? • Population size in the next generation will depend on the base and the difference between births and deaths • assuming we have an isolated group of individuals Nt+1= Nt + b – d
What if processes vary with density? • If populations get larger, what do you predict will happen to birth rates? • If populations get larger, what do you predict will happen to death rates? • How many individuals are added to the population when birth rates and death rates are equal?
Summary of population models • The Logistic model of density dependence predicts maximal sustainable yield at ½ K • “S-shape” curve of population growth may not be seen when • The response to density lags changes in the environment • For populations with large excesses of births (r>2) and where generations are distinct
Added realism: individuals vary in “b” and “d” • Size (or age) influences • Reproductive capacity (# of offspring likely) • The risk of being eaten by a predator • The probability of being captured in a net • Age-specific demographic processes • Fecundity • Survivorship
Age-specific parameters • Start with a bunch of ♀ individuals newly born (= a cohort) • Determine the number of individuals that survive to each successive age (“x”) • Sx • The probability of survival from birth to age, “x”: lx • The number of ♀ offspring produced per ♀ individual of age “x”:mx
Life Table = collection of data on Sx, lx, mx • We can then project how each cohort will contribute to the population through its lifetime • Some values derived from a life table: • Net Reproductive Rate, R0= the number of ♀ progeny expected to accumulate during the entire lifetime of an average ♀ • Intrinsic growth rate, r • Reproductive Value (Vx) = the expected number of future ♀ progeny for a ♀ of age “x” (relative to that of a newborn, = R0)
The real world is not a set of simple equations • Randomness is a factor • “Deterministic” models always follow the same path given the same conditions • “Stochastic” models include chance • How is this done? • Use an average value for a parameter • But for any generation, the value used can deviate somewhat from that average • “Coefficient of Variation” and “distribution” define the limits of deviation
What are the connections between food web and demographic approaches? • What demographic parameters are influenced? • Are models still useful and how?