Download
1 / 96
1k likes | 1.42k Views
DETECTORS AND DETECTOR ARRAYS. Xenon Detectors. Xenon detectors use high-pressure (about 25 arm) nonradioactive xenon gas, in long thin cells between two metal plates. .

E N D
Xenon Detectors • Xenon detectors use high-pressure (about 25 arm) nonradioactive xenon gas, in long thin cells between two metal plates.
The sepra that separate the individual xenon detectors can also be made quite thin, and this improves the geometric efficiency by reducing dead space between detectors. • The geometric efficiency is the fraction of primary x-rays exiting the patient that strike active detector elements.
The long, thin ionization plates of a xenon detector are highly directional. • For this reason, xenon detectors must be positioned in a fixed orientation with respect to the x-ray source. • Therefore, xenon detectors cannot be used for fourth-generation scanners, because those detectors have to record x-rays as the source moves over a very wide angle. • Xenon detectors can be used only for third-generation systems.
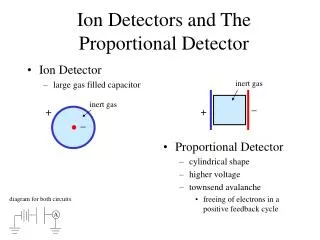
Xenon detectors for CT are ionization detectors—a gaseous volume is surrounded by two metal electrodes, with a voltage applied across the two electrodes. • As x-rays interact with the xenon atoms and cause ionization (positive atoms and negative electrons), the electric field (volts per centimeter) between the plates causes the ions to move to the electrodes, where the electronic charge is collected.
The electronic signal is amplified and then digitized, and its numerical value is directly proportional to the x-ray intensity striking the detector. • Xenon detector technology has been surpassed by solid-state detectors, and its use is now relegated to inexpensive CT scanners.
Xenon detector arrays are a series of highly directional xenon-filled ionization chambers. As x-rays ionize xenon atoms, the charged ions are collected as electric current at the electrodes. The current is proportional to the x-ray fluence.
Solid-State Detectors • A solid-state CT detector is composed of a scintillator coupled tightly toa photodetector. • The scintillator emits visible light when it is struck by x-rays, just as in an x-ray intensifying screen.
The light emitted by the scintillator reaches the photodetector, typically a photodiode, which is an electronic device that converts light intensity into an electrical signal proportional to the light intensity.
This scincillator-photodiode design of solid-state CT detectors is very similar in concept to many digital radiographic x-ray detector systems; however, the performance requirements of CT are slightly different. • The detector size in CT is measured in millimeters (typically 1.0 x 15 mm or 1.0 x 1.5 mm for multiple detector array scanners), whereas detector elements in digital radiography systems are typically 0.10 to 0.20 mm on each side.
CT requires a very high-fidelity, low-noise signal, typically digitized to 20 or more bits.
The scintillator used in solid-state CT detectors varies among manufacturers, with CdWO4, yttrium and gadolinium ceramics, and other materials being used. • Because the density and effective atomic number of scintillators are substantially higher than those of pressurized xenon gas, solid-state detectors typically have better x-ray absorption efficiency. • However, to reduce crosstalk between adjacent detector elements, a small gap between detector elements is necessary, and this reduces the geometric efficiency somewhat.
Multiple Detector Arrays • Multiple detector arrays are a set of several linear detector arrays, tightly abutted.
The multiple detector array is an assembly of multiple solid-state detector array modules.
With a traditional single detector array CT system, the detectors are quite wide (e.g., 15 mm) and the adjustable collimator determines slice thickness, typically between 1 and 13 mm. • With these systems, the spacing between the collimator blades is adjusted by small motors under computer control. • With multiple detector arrays, slice width is determined by the detectors, not by the collimator (although a collimator does limit the beam to the total slice thickness).
To allow the slice width to be adjustable, the detector width must be adjustable. • It is not feasible, however, to physically change he width of the detector arrays per se. • Therefore, with multislice systems, the slice width is determined by grouping one or more detector units together.
For one manufacturer, the individual detector elements are 1.25 mm wide, and there are 16 contiguous detectors across the module. • The detector dimensions are referenced to the scanner’s isocenter, the point at the center of gantry rotation.
The electronics are available for four detector array channels, and one, two, three or four detectors on the detector module can be combined to achieve slices of4 x 1.25 mm, 4 x 2.50 mm, 4 x 3.75 mm, or 4 x 5.00 mm. • To combine the signal from several detectors, the detectors are essentially wired together using computer-controlled switches.
Other manufacturers use the same general approach but with different detector spacings. • For example, one manufacturer uses 1-mm detectors everywhere except in the center, where four 0.5-mm-wide detectors are used. • Other manufacturers use a gradually increasing spacing, with detector widths of 1.0, 1.5, 2.5, and 5.0 mm going away from the center. • Increasing the number of active detector arrays beyond four (used in the example discussed) is a certainty.
Multiple detector array CT scanners make use of solid-state detectors. • For a third-generation multiple detector array with 16 detectors in the slice thickness dimension and 750detectors along each array, 12,000 individual detector elements are used.
The fan angle commonly used in third-generation CI scanners is about 60 degrees, so fourth-generation scanners (which have detectors placed around 360 degrees) require roughly six times as many detectors as third-generation systems. • Consequently, all currently planned multiple detector array scanners make use of third-generation geometry.
Slice Thickness: Single Detector Array Scanners • The slice thickness in single detector array CT systems is determined by the physical collimation of the incident x-ray beam with two lead jaws. • As the gap between the two lead jaws widens, the slice thickness increases. • The width of the detectors in the single detector array places an upper limit on slice thickness.
Opening the collimation beyond this point would do nothing to increase slice thickness, but would increase both the dose to the patient and the amount of scattered radiation.
There are important tradeoffs with respect to slice thickness. • For scans performed at the same kV and mAs, the number of detected x-ray photons increases linearly with slice thickness. • For example, going from a 1-mm to a 3-mm slice thickness triples the number of detected x-ray photons, and the signal-to-noise ratio (SNR) increases by 73%, since .
Increasing the slice thickness from 5to 10 mm with the same x-ray technique (kV and mAs) doubles the number of detected x-ray photons, and the SNR increases by 41%: .
Larger slice thicknesses yield better contrast resolution (higher SNR) with the same x-ray techniques, but the spatial resolution in the slice thickness dimension is reduced. • Thin slices improve spatial resolution in the thickness dimension and reduce partial volume averaging. • For thin slices, the mAs of the study protocol usually is increased to partially compensate for the loss of x-ray photons resulting from the collimation.
It is common to think of a CT image as literally having the geometry of a slab of tissue, but this is not actually the case. • The contrast of a small (e.g., 0.5 mm), highly attenuating ball bearing is greater if the bearing is in the center of the CT slice, and the contrast decreases as the bearing moves toward the edges of the slice.
This effect describes the slice sensitivity profile. • For single detector array scanners, the shape of the slice sensitivity profile is a consequence of the finite widyh of the x-ray focal spot, the penumbra of the collimator, the factthat the image is computed from a number of projection angles encircling the patient, and other minor factors. • Furrhermore, helical scans have a slightly broader slice sensitivity profile due to translation of the patient during the scan.
The nominal slice thickness is that which is set on the scanner control panel. • Conceptually, the nominal slice is thought of as having a rectangular slice sensitivity profile.
Slice Thickness: Multiple Detector Array Scanners • The slice thickness of multiple detector array CT scanners is determined not by the collimation, but rather by the width of the detectors in the slice thickness dimension. • The width of the detectors is changed by binning different numbers of individual detector elements together—that is, the electronic signals generated by adjacent detector elements are electronically summed.
Multiple detector arrays can be used both in conventional axial scanning and in helical scanning prorocols. • In axial scanning (i.e.. with no table movement) where, for example, four detector arrays are used, the width of the two center detector arrays almost completely dictates the thickness of the slices.
For the two slices at the edges of the scan (detector arrays 1 and 4 of the four active detector arrays), the inner side of the slice is determined by the edge of the detector, but the outer edge is determined either by the collimator penumbra or the outer edge of the detector, depending on collimator adjustment.
With a multiple detector array scanner in helical mode, each detector array contributes to every reconstructed image, and therefore the slice sensitivity profile for each detector array needs to be similar to reduce artifacts. • To accommodate this condition, it is typical to adjust the collimation so that the focal spot—collimator blade penumbra falls outside the edge detectors.
This causes the radiation dose to be a bit higher (especially for small slice widths) in multislice scanners, but ii reduces artifacts by equalizing the slice sensitivity profiles between the detector arrays.
Detector Pitch and Collimator Pitch • Pitch is a parameter that comes to play when helical scan protocols are used. • In a helical CT scanner with one detector array, the pitch is determined by the collimator (collimator pitch) and is defined as:
It is customary in CT to measure the collimator and detector widths at the isocenter of the system. • The collimator pitch represents the traditional notion of pitch, before the introduction o multiple detector array CT scanners.
Pitch is an important component of the scan protocol, and it fundamentally influences radiation dose to the patient, image quality, and scan time.
For single detector array scanners, a pitch of 1.0 implies that the number of CT views acquired, when averaged over the long axis of the patient, is comparable to the number acquired with contiguous axial CT. • A pitch of less than 1.0 involves overscanning, which may result in some slight improvement in image quality and a higher radiation dose to the patient.
CT manufacturers have spent a great deal of developmental effort in optimizing scan protocols for pitches greater than 1.0, and pitches up to 1.5 are commonly used. • Pitches with values greater than 1.0 imply some degree of partial scanning along the long axis of the patient. • The benefit is faster scan time, less patient motion, and, in some circumstances, use of a smaller volume of contrast agent.
Although CT acquisitions around 360 degrees are typical for images of the highest fidelity, the minimum requirement to produce an adequate CT image is a scan of 180 degrees plus the fan angle. • With fan angles commonly at about 60 degrees, this means that, at a minimum, (180 + 60)/360, or 0.66, of the full circle is required.
This implies that the upper limit on pitch should be about 1/0.66, or 1.5, because 66% of the data in a 1.5-pitch scan remains contiguous.
Scanners that have multiple detector arrays require a different definition of pitch. • The collimator pitch defined previously is still valid, and collimator pitches range between 0.75 and 1.5, as with single detector array scanners.
The detector pitch is also a useful concept for multiple detector array scanners, and it is defined as:
The need to define detector pitch and collimator pitch arises because beam utilization between single and multiple detector array scanners is different.
For a multiple detector array scanner with N detector arrays, the collimator pitch is as follows:
TOMOGRAPHIC RECONSTRUCTION Rays and Views: The Sinogram • The data acquired for one CT slice can be displayed before reconstruction. • This type of display is called a sinogram.
Sinograms are not used for clinical purposes, but the concepts that they embody are interesting and relevant to understanding tomographic principles. • The horizontal axis of the sinogram corresponds to the different rays in each projection. • For a third-generation scanner, for example, the horizontal axis of the sinogram corresponds to the data acquired at one instant in time along the length of the detector array.
A bad detector in a third-generation scanner would show up as a vertical line on the sinogram.