Download
1 / 11
110 likes | 259 Views
Colonial El Niño Famines (1876-1900)

E N D
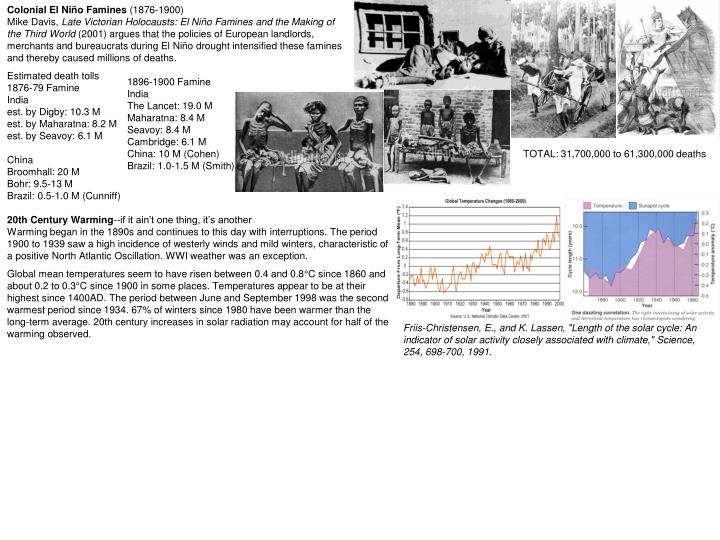
Colonial El Niño Famines (1876-1900) Mike Davis, Late Victorian Holocausts: El Niño Famines and the Making of the Third World (2001) argues that the policies of European landlords, merchants and bureaucrats during El Niño drought intensified these famines and thereby caused millions of deaths. Estimated death tolls 1876-79 Famine India est. by Digby: 10.3 M est. by Maharatna: 8.2 M est. by Seavoy: 6.1 M China Broomhall: 20 M Bohr: 9.5-13 M Brazil: 0.5-1.0 M (Cunniff) 1896-1900 Famine India The Lancet: 19.0 M Maharatna: 8.4 M Seavoy: 8.4 M Cambridge: 6.1 M China: 10 M (Cohen) Brazil: 1.0-1.5 M (Smith) TOTAL: 31,700,000 to 61,300,000 deaths 20th Century Warming--if it ain’t one thing, it’s another Warming began in the 1890s and continues to this day with interruptions. The period 1900 to 1939 saw a high incidence of westerly winds and mild winters, characteristic of a positive North Atlantic Oscillation. WWI weather was an exception. Global mean temperatures seem to have risen between 0.4 and 0.8°C since 1860 and about 0.2 to 0.3°C since 1900 in some places. Temperatures appear to be at their highest since 1400AD. The period between June and September 1998 was the second warmest period since 1934. 67% of winters since 1980 have been warmer than the long-term average. 20th century increases in solar radiation may account for half of the warming observed. Friis-Christensen, E., and K. Lassen, "Length of the solar cycle: An indicator of solar activity closely associated with climate," Science, 254, 698-700, 1991.
European Climate Change Global Warming Models Labeled 'Fairy Tale' By Team of Scientists 11-21-02 original post date: 5-15-02 - Washington - A team of international scientists Monday said climate models showing global warming are based on a "fairy tale" of computer projections. Hartwig Volz, a geophysicist with the RWE Research Lab in Germany questioned the merit of the climate projections coming from the United Nations sponsored Intergovernmental Panel on Climate Change (IPCC.) The IPCC climate projections have fueled worldwide support for the Kyoto Protocol, which aims to restrict the greenhouse gases thought to cause global warming. Volz noted that the IPCC does not even call the climate models "predictions" and instead refers to them as "projections" or "story lines." Volz said the projections might be more aptly termed "fairy tales." S. Fred Singer, an atmospheric physicist with the University of Virginia and the Environmental Policy Project, called the IPCC's global warming projections "completely unrealistic." "Prediction is a very difficult business, particularly about the future," he said. Singer accused the IPCC of "assuming extreme scenarios of population growth and fossil fuel consumption" and called on the Bush administration to "assemble another team using the IPCC report -- using the same facts" to "write a different summary." Dr. Ulrich Berner, a geologist with the Federal Institute for Geosciences in Germany, said global temperatures have varied greatly in the earth's history and are unrelated to human activity. "The climate of the past has varied under natural conditions without the influence of humans," Berner said. Berner also declared that an extensive analysis of carbon dioxide (CO2) concentrations in the ice core of Greenland showed that elevated CO2 in the atmosphere does not necessarily lead to temperature increases. "There are numerous temperature changes which are not mimicked by the CO2 concentration," Berner explained. "Carbon Dioxide doesn't police climatic changes. Climatic changes have always occurred and will for the future always occur," Berner added. Singer agreed, stating, "The balance of evidence suggests that there has been no appreciable warming since 1940. This would indicate that the human effects on climate must be quite small." Singer pointed to the sun as a major culprit in climate change. "The sun is responsible for most, and perhaps all of the short-term climate changes we observe," he said. 'Mud and rain and wretchedness and blood'. Why should jolly soldier-boys complain? God made these before the roofless Flood Mud and rain. Mangling crumps and bullets through the brain, Jesus never guessed them when He died. Jesus had a purpose for His pain, Ay, like abject beasts we shed our blood, Often asking if we die in vain. Gloom conceals us in a soaking sack Mud and rain. (Diaries 102) Northern and Western Europe experienced more rainfall, as mud-bound troops on the Western Front in 1916 experienced. Soldiers said they experienced "constant rain, gray skies, and mud everywhere. We sink into it up to our knees, sloppy dreadful stuff that rots our feet. No one fights on either side, we just suffer silently in the wet.” The spring of 1916 was abnormally bad. Rain poured down for several weeks without ceasing. Mud became a problem after artillery shells had torn up the French landscape. Some places it was 4-5 feet deep, and made travel impossible. Canadian practice battle, Toronto Canadian practice trench, Winnipeg
Dead Man's Trench Looking at the trenches of the enemy line, They are marching in endless rows of nine by nine. As I sit in the mud, it makes me sick. Like slime, the mud just seems to stick. Looking at my gun, barrel full of mud, So that's why my last shot seemed to be a dud. I hear a big bang and everyone starts to run wildly. Then I notice that half the army is right behind me. Still sloshing through the mud, I come to the end of the line. This additional precipitation continued into the 1920s and 1930s as sub-polar cyclones became larger and spread their wind circulation further into the Arctic. The warming increased the length of the growing season in Western Europe by as much as two weeks compared with mid-19th century. After 1925, Alpine glaciers disappeared from valley floors up into the mountains. Equivalent stronger westerlies over the Pacific extended the arid rain shadow of the Rockies eastward causing the droughts of the dust bowl in Oklahoma in the 1930s. This came after the North American farmers made tremendous technological (and financial) advances for feeding Europe. They farmed areas that had formerly been unsuitable before the excess rains of the 1910s and 1920s. The drought hit first in the eastern part of the country in 1930. In 1931, it moved toward the west. By 1934 it had turned the Great Plains into a desert. "If you would like to have your heart broken, just come out here," wrote Ernie Pyle, a roving reporter in Kansas, just north of the Oklahoma border, in June of 1936. "This is the dust-storm country. It is the saddest land I have ever seen." The Dust Bowl lasted about 10 years and changed America as well as the rest of the world because of the side effects that resulted.
"The land just blew away; we had to go somewhere." -- Kansas preacher, June, 1936 The average American was busy buying automobiles and household appliances, and speculating in the stock market, where big money could be made. Those appliances were bought on credit, however. Although businesses had made huge gains -- 65 percent -- from the mechanization of manufacturing, the average worker's wages had only increased 8 percent. Ultimately this leads to the Great Depression. Air temperatures around the world peaked in the early 1940s. Locations at the edge of the Arctic like Iceland and Spitzbergen experienced more warming than Europe. The area covered by pack ice decreased by 10 to 20%. Snow levels moved up slope. Ships could visit Spitzbergen 7 months of the year rather than the 3 months before 1920. The distribution and variability of rainfall altered over much of the world too. WWII weather leads to the turning point The winters of the early 1940s stalled Hitler's attempt to conquer Russia. Millions died in the cold near Stalingrad. Vasily Zaitsev The first onslaught of Operation Barbarossa in 1941 had carried the German armies to the outskirts of Moscow and Leningrad. In summer 1942 Hitler's main target was the oil fields of the Caucasus - their capture would deprive the Russians of their fuel supply. An army was to advance down the Volga to Astrakhan and ultimately Baku. The change in atmospheric circulation brought much more reliable monsoon winds to India which experienced only two partial monsoon failures between 1925 and 1960, compared to the catastrophic failures of the late 19th century when millions of Indian Villagers died in famines. Simultaneously the German 6th Army was ordered to take Stalingrad- 'smash the enemy forces concentrated there, occupy the town and block land communications between the Don and the Volga'. The warmer and wetter weather that followed led scientists to began talking about the possibility of occupying and farming land farther to the north, and other benefits of the warming. Then, it started to get cold again. In the 1950s a change in circulation lowered global temperatures to the level of 1900-20. The winter of 1962-3 was the coldest in England since 1740. It was cold again in 1965-6, and in 1968, Iceland was completely surrounded by sea-ice. 1970s The 1972-3 El Niño was coupled with a change in atmospheric circulation. Although the 1972-3 El Niño generated a lot of basic research, it was the big one in 1982-3 that surprised everyone and led to its current mass media coverage. NYC, 1973
Global warming leads to more snow? Burnett, Mullins, Kirby, and Patterson, Journal of Climate, 2003 Other climate changes in the 20th century Although there are some regional anomalies, there is evidence that climate change has had an impact in the Arctic and the Antarctic. Many documented changes parallel those forecast to result from climate change. In the Arctic, extensive land areas show a 20th-century warming trend in air temperature of as much as 5°C. Over sea ice, there has been slight warming in the 1961-1990 period and precipitation has increased. Arctic sea-ice extent has decreased by 2.9% per decade over the 1978-1996 period; sea ice has thinned, and there are now more melt days per summer. Sea-ice extent in the Nordic seas has decreased by 30% over the past 130 years. It is not yet clear whether changes in sea ice of the past few decades are linked to a natural cycle in climate variability or have resulted explicitly from global warming. Atlantic water flowing into the Arctic Ocean has warmed, and the surface layer has become thinner. The mixed layer in the Beaufort Sea has become less saline. Regions underlain by permafrost have been reduced in extent, and a general warming of ground temperatures has been observed in many areas.***** There has been a statistically significant decrease in spring snow extent over Eurasia since 1915.**** In summary, many observations of environmental change in the Arctic show a trend that is consistent with warming and similar to that predicted by general circulation models (GCMs). In the Antarctic, over the past half-century there has been a marked warming trend in the Antarctic Peninsula.**** Elsewhere there is a general but not unambiguous warming trend.** Precipitation in the Antarctic has increased.* Satellite observations show no significant change in Antarctic sea-ice extent over the 1973-1996 period.***** Analysis of whaling records and modeling studies indicate that Antarctic sea ice retreated south by 2.8 degrees of latitude between the mid-1950s and the early 1970s.*** Surface waters of the Southern Ocean have warmed and become less saline.*** Impacts Substantial warming and increases in precipitation are projected for polar regions over the 21st century by almost all climate models. There are eight key concerns related to the impact of this climate change in the Arctic and Antarctic. Associated with these concerns will be changes to the atmosphere and the oceans that will propagate to other regions of the world: 1. Changes in ice sheets and polar glaciers: Increased melting is expected on Arctic glaciers and the Greenland ice sheet, and they will retreat and thin close to their margins. Most of the Antarctic ice sheet is likely to thicken as a result of increased precipitation. There is a small risk, however, that the West Antarctic and Greenland ice sheets will retreat in coming centuries. Together, these cryospheric changes may make a significant contribution to sea-level rise.**** 2. Changes around the Antarctic Peninsula: This region has experienced spectacular retreat and collapse of ice shelves, which has been related to a southerly migration of the January 0°C isotherm resulting from regional warming. The loss of these ice shelves has few direct impacts. Projected warming is likely, however, to break up ice shelves further south on the Antarctic Peninsula, expose more bare ground, and cause changes in terrestrial biology, such as introduction of exotic plants and animals.****
3. Changes in the Southern Ocean and impacts on its life: Climate change is likely to produce long-term—perhaps irreversible—changes in the physical oceanography and ecology of the Southern Ocean. Projected reductions in sea-ice extent will alter under-ice biota and spring bloom in the sea-ice marginal zone and will cause profound impacts at all levels in the food chain, from algae to krill to the great whales. Marine mammals and birds, which have life histories that tie them to specific breeding sites, will be severely affected by shifts in their foraging habitats and migration of prey species. Warmer water will potentially intensify biological activity and growth rates of fish. Ultimately, this should lead to an increase in the catch of marketable fish, and retreat of sea ice will provide easier access to southern fisheries.*** A 40,000 year record of isotope values from penguin eggshells tells a story of athropogenic effects and natural climate variation for the Antarctic. Cape Evans Hut, 1911-1917 Krill Surplus Hypothesis Extensive slaughter of whales and seals in 19th and 20th centuries in Southern Ocean Reduced whale populations by 90-95 %, still in recovery Caused near extinction of Antarctic and sub-Antarctic Fur Seals (Arctocephalus gazella and A. tropicalis) Resulted in >150 tons excess krill History of Exploitation (Ellis, 1991) Sealing began on Falklands in 1766 and on South Georgia Island in 1786 In 1775, 13,000 fur seal skins were taken from Falklands by one ship 1793-1807, est. 3.2 million fur seal skins taken; by 1819 operations moved into Antarctic Peninsula 300,000 skins taken from AP in four years, industry ends Whaling began in earnest by late 1800s 4. Changes in sea ice: There will be substantial loss of sea ice in the Arctic Ocean. Predictions for summer ice indicate that its extent could shrink by 60% for a doubling of carbon dioxide (CO2), opening new sea routes. This will have major trading and strategic implications. With more open water, there will be a moderation of temperatures and an increase in precipitation in Arctic lands. Antarctic sea-ice volume is predicted to decrease by 25% or more for a doubling of CO2, with sea ice retreating about 2 degrees of latitude.**** 5. Changes in permafrost: Thickening of the seasonally thawed layer above permafrost (active layer) is expected. Modeling studies indicate that large areas of permafrost terrain will begin to thaw, leading to changes in drainage, increased mass movements, thermal erosion, and altered landscapes in much of the Arctic and subarctic. Warming of permafrost, thawing of ground ice, and development of thermokarst terrain have been documented over the past several decades. In developed areas of the Arctic, continuation of such changes may lead to costly damage to human infrastructure.****
6. Changes in Arctic hydrology: The hydrology of the Arctic is particularly susceptible to warming because small rises in temperature will result in increased melting of snow and ice, with consequent impacts on the water cycle. There will be a shift to a runoff regime that is driven increasingly by rainfall, with less seasonal variation in runoff. There will be more ponding of water in some areas, but peatlands may dry out because of increased evaporation and transpiration from plants. In some areas, thawing of permafrost will improve infiltration. An expected reduction in ice-jam flooding will have serious impacts on riverbank ecosystems and aquatic ecology, particularly in the highly productive Arctic river deltas. Changes in Arctic runoff will affect sea-ice production, deepwater formation in the North Atlantic, and regional climate. A major impact would result from a weakening of the global thermohaline circulation as a result of a net increase in river flow and the resulting increased flux of freshwater from the Arctic Ocean.*** 7. Changes in Arctic biota: Warming should increase biological production; however, the effects of increased precipitation on biological production are unclear. As warming occurs, there will be changes in species compositions on land and in the sea, with a tendency for poleward shifts in species assemblages and loss of some polar species. Changes in sea ice will alter the seasonal distributions, geographic ranges, patterns of migration, nutritional status, reproductive success, and ultimately the abundance and balance of species. Animals that are dependent on sea ice—such as seals, walrus, and polar bears—will be disadvantaged. High-arctic plants will show a strong growth response to summer warming. It is unlikely that elevated CO2 levels will increase carbon accumulation in plants, but they may be damaged by higher ultraviolet-B radiation. Biological production in lakes and ponds will increase.*** 8. Impacts on human communities: Climate change, in combination with other stresses, will affect human communities in the Arctic. The impacts may be particularly disruptive for communities of indigenous peoples following traditional lifestyles. Changes in sea ice, seasonality of snow, and habitat and diversity of food species will affect hunting and gathering practices and could threaten longstanding traditions and ways of life. On the other hand, communities that practice these lifestyles may be sufficiently resilient to cope with these changes. Increased economic costs are expected to affect infrastructure, in response to thawing of permafrost and reduced transportation capabilities across frozen ground and water. However, there will be economic benefits—including new opportunities for trade and shipping across the Arctic Ocean, lower operational costs for the oil and gas industry, lower heating costs, and easier access for ship-based tourism.***** Drought again Between 1968 and 1973 prolonged drought in the Sahel of the Sahara, killed 250,000 people and many cattle. By 1985, 1.2 million people died. Then suddenly, the NAO switched to high again and the heat was on again. Record heat waves toasted northern Europe in 1975-1976 weather extremes seemed to be more common, hurricanes, droughts, etc. 1970-85 Famine Blamed on Pollution Nearly two decades after one of the world's most devastating famines in Africa, scientists are pointing a finger at pollution from industrial nations as one of the possible causes.
Desertification The United Nations Convention to Combat Desertification (UNCCD, 1994) defines desertification as "land degradation in arid, semi-arid, and dry subhumid areas resulting from various factors, including climatic variations and human activities”. Furthermore, UNCCD defines land degradation as a "reduction or loss, in arid, semi-arid, and dry subhumid areas, of the biological or economic productivity and complexity of rain-fed cropland, irrigated cropland, or range, pasture, forest, and woodlands resulting from land uses or from a process or combination of processes, including processes arising from human activities and habitation patterns, such as: (i) soil erosion caused by wind and/or water; (ii) deterioration of the physical, chemical, and biological or economic properties of soil; and (iii) long-term loss of natural vegetation."
Arid, semi-arid, and dry subhumid areas include those lands where the ratio of precipitation to potential evaporation (PET) ranges from 0.05 to 0.65. In Africa, these conditions cover 13 million km2, or 43% of the continent's land area—on which 270 million people, or 40% of the continent's population, live (UNDP, 1997). Areas particularly at risk include the Sahel—a 3.5 million km2 band of semi-arid lands stretching along the southern margin of the Sahara Desert—and some nations that consist entirely of drylands (e.g., Botswana and Eritrea). The death of 250,000 people in the Sahel drought of 1968-1973 demonstrated the tragic human toll of desertification. Aridity zones for Africa as derived from mean monthly precipitation and potential evapotranspiration surfaces. Desertification in Africa has reduced by 25% the potential vegetative productivity of more than 7 million km2, or one-quarter of the continent's land area. Desertification consists more of degradation of the productive capacity of patches well outside open-sand deserts rather than the inexorable encroachment of open sand onto greenlands. Arid lands can respond quickly to seasonal fluctuations. Indeed, analysis of 1980-1990 data to track the limit of vegetative growth along the Sahara-Sahel margin revealed wide fluctuations: The 1990 limit of vegetative growth lay 130 km south of its 1980 position. Unfortunately, the relative importance of climatic and anthropogenic factors in causing desertification remains unresolved. Some scientists have judged that anthropogenic factors outweigh climatic factors though others maintain that extended droughts remain the key factor. Nonclimatic Driving Forces of Desertification Unsustainable agricultural practices, overgrazing, and deforestation constitute the major anthropogenic factors among the forces that drive desertification. Unsustainable agricultural practices include short rotation of export crops, undisciplined use of fire, and removal of protective crop residues. Overgrazing consists of running livestock at higher densities or shorter rotations than an ecosystem sustainably can support. Finally, deforestation consists of permanent clearing of closed-canopy forests and cutting of single trees outside forests. Forest area in Africa decreased by approximately 37,000 km2 yr-1 from 1990 to 1995. UNEP (1997) attributes two-thirds of the area already desertified in Africa to overgrazing and the remaining third to unsustainable agricultural and forestry practices. Population growth ultimately can drive desertification if it intensifies exploitation or if it increases the land area subjected to unsustainable agricultural practices, overgrazing, or deforestation. The total population of Africa grew from 220 million in 1950 to 750 million in 1998—a rate of 2.5% yr-1 (United Nations, 1999). Increasing food, wood, and forage needs accompanying this growth place an inordinate burden on the region's natural resources. Climatic Factors in Desertification Precipitation and temperature determine the potential distribution of terrestrial vegetation and constitute principal factors in the genesis and evolution of soil. Extended droughts in certain arid lands have initiated or exacerbated desertification. In the past 25 years, the Sahel has experienced the most substantial and sustained decline in rainfall recorded anywhere in the world within the period of instrumental measurements (Hulme and Kelly, 1997). Since 1971, the average of all stations fell below the 89-year average and showed a persistent downward trend since 1951. Because evapotranspiration constitutes the only local input to the hydrological cycle in areas without surface water, reduction in vegetative cover may lead to reduced precipitation, initiating a positive feedback cycle. Ethiopia 1984 Band Aid-- But say a prayer, pray for the other ones At Christmas time it's hard, but when you're having fun There's a world outside your window, and it's a world of dread and fear Where the only water flowing, is the bitter sting of tears And the Christmas bells that ring, there are the clanging chimes of doom Well tonight thank God it's them instead of you Feed the world, Let them know it's Christmas time Feed the world, Do they know it's Christmas time at all?
Degradation of vegetation cover in moister areas south of the Sahel may have decreased continental evapotranspiration and reduced precipitation in the Sahel. A positive feedback mechanism between vegetation cover and albedo may help to explain the Sahel drought. Some research supports an albedo-precipitation feedback mechanism. Degraded land also may increase atmospheric dust and aerosols, which influence precipitation. SST anomalies, often related to ENSO or NAO, also contribute to rainfall variability in the Sahel. Lamb (1978) observed that droughts in West Africa correlate with warm SST in the tropical south Atlantic. Examining oceanographic and meteorological data from the period 1901-1985, scientists found that persistent wet and dry periods in the Sahel were related to contrasting patterns of SST anomalies on a near-global scale. When northern hemisphere oceans were cold, rainfall in the Sahel was low. Injections of freshwater into the north Atlantic (such as from glacial melt) decrease salinity—stabilizing the water column, inhibiting deep convection, and reducing northern transport of heat by the Atlantic thermohaline circulation, which is driven by a north-south SST gradient. This decreases evaporation from the ocean surface, causing drought in the Sahel and Mexico. From 1982 to 1990 a correlation was found between ENSO-cycle SST anomalies and vegetative production in Africa. Warmer eastern equatorial Pacific waters during ENSO episodes correlated with rainfall of <1,000 mm yr-1 over certain African regions. A combination of factors—including vegetation cover, soil moisture, and SST—best explains the reduction in rainfall in the Sahel. Changes in albedo, soil moisture, land surface roughness, and SST anomalies and calculated a rainfall deficit were modeled over the Sahel similar to observed patterns. A coupled surface-atmosphere model indicates that—whether anthropogenic factors or changes in SST initiated the Sahel drought of 1968-1973—permanent loss of Sahel savanna vegetation would permit drought conditions to persist (Wang and Eltahir, 2000). Zeng et al. (1999) compared actual rainfall data from the period 1950-1998 with the output of a coupled atmosphere-land-vegetation model incorporating SST, soil moisture, and vegetative cover. Their results indicate that actual rainfall anomalies are only weakly correlated to SST by itself. Only when the model includes variations in vegetative cover and soil moisture does it come close to matching actual rainfall data. Modeling the importance of SST, sea ice, and vegetative cover to the abrupt desertification of the Sahara 4,000-6,000 years ago, Claussen et al. (1999) show that changes in vegetative cover best explain changes in temperature and precipitation. NORTH KOREA FAMINE COMPARED TO SOVIET UKRAINE FAMINE IN 1933 North Korea- Korea suffered in 1995 from the worst floods in a century. Severe floods revisited Korea in 1996. In 1997, parts of the country were hit with months of high temperatures and drought. In August 1997, Typhoon Winnie smashed coastal areas and devastated coastal rice paddies. "Andrew Natsios, administrator of the U.S. Agency for International Development, has compared the North Korean food shortage with famines that killed 7 million people in the Soviet Ukraine in 1933 and 30 million people in China's "Great Leap Forward" in the late 1950s." "Kim is an upgraded version of Nazi Germany's Hitler," Dr. Vollertsen (Doctors without borders) said after emerging from North Korea. "He's committing genocide." 2000 and beyond Falls Road Belfast Afghanistan- drought of 2000