Download
1 / 31
310 likes | 506 Views
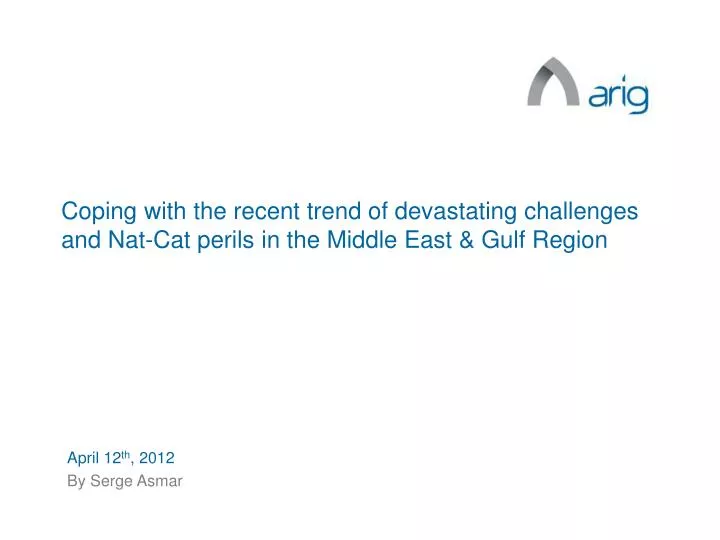
Coping with the recent trend of devastating challenges and Nat-Cat perils in the Middle East & Gulf Region. April 12 th , 2012 By Serge Asmar. 1. Introduction. General Information Recent regional history Exposures & statistical information Market Reaction Recommendations. 2.

E N D
Coping with the recent trend of devastating challenges and Nat-Cat perils in the Middle East & Gulf Region April 12th, 2012 By Serge Asmar 1
Introduction • General Information • Recent regional history • Exposures & statistical information • Market Reaction • Recommendations 2
General View of the Middle East & Gulf Region • * Total Selected Countries : • Population : 287mn • GDP : $ 2 trillion • GDP / per capita : $ 6,808 (vs. • $ 9,228 Global) • Oil Reserves : 760bn barrels Source : AXCO Website, CIA Website “https://www.cia.gov/library/publications/the-world-factbook/rankorder/2178rank.html”
Average GDP per capita & Average Non-Life Ins. per capita • Comparison with • selected countries • Legislation /Regulatory • Lack of awareness • Low insurance • penetration • Opportunity • Political Instability Source : AXCO Website
A Glimpse of the Region • Construction boom • Infrastructure, Utilities, Roads… • Expansion in the Oil and Energy • Sector • Shifts in business operations • Political stability • Tax haven • Business friendly
Cont’d: A Glimpse of the Region • High Value Risks (towers, islands on reclaimed land) • Development of new commercial hubs & • infrastructures • Concentration of risks
Cont’d: A Glimpse of the Region • Instability and post-war • opportunities (i.e. Leb., • Iraq, Syria etc…) • Evolving cities and • rebuilding infrastructures • Taking part of global • economy
Global Statistics & Fact Figures EM-DAT : The OFDA / CRED International Disaster Database – www.emdat.be – Université Catholique de Louvain, Brussels - Belgium
Cont’d: Global Statistics & Fact Figures EM-DAT : The OFDA / CRED International Disaster Database – www.emdat.be – Université Catholique de Louvain, Brussels - Belgium
Cont’d: Global Statistics & Fact Figures EM-DAT : The OFDA / CRED International Disaster Database – www.emdat.be – Université Catholique de Louvain, Brussels - Belgium
Regional Statistics & Fact Figures Source: "EM-DAT: The OFDA/CRED International Disaster Database, www.emdat.be - Université catholique de Louvain - Brussels - Belgium” Egypt 1980 to present, Iran 1895 to present, Jordan 1981 to present, Morocco 1920 to present, Syria 1980 to present, Yemen 1971 to present
Assessing the Risk of Earthquake Elements that determine a Cat Loss: Adequate earthquake risk assessment needs numerical risk models Risk models are only as good as available scientific knowledge Any improvement in scientific knowledge will help experts better quantify the potential risk in parallel with understanding: Hazard : Frequency / Severity Risk distribution and values at risk Vulnerability : how well built and protected Conditions : what are we covering, limits, deductibles, exclusions, etc… 12
Overview of Regional Nat-Cats(Yemen Earthquake December 13, 1982) • Disasters can strike anywhere • at anytime • A real struggling challenge in • the region (i.e. Much of the un- • reinforced stone masonry in • Risabah collapsed during the • magnitude 6.0 shock ) • The city was approximately 6 • miles from the epicenter
Cont’d: Overview of Regional Nat-Cats (Cyclone Gonu) Formed June 1, 2007 Dissipated June 7, 2007 Highest winds 3-minute sustained: 235 km/h (145 mph) 1-minute sustained: 270 km/h (165 mph) Lowest pressure 920 mbar (hPa); 27.17 inHg Fatalities 78 total, 37 missing Damage $3.9 billion (2007 USD) Areas affected Oman, United Arab Emirates, Iran, Pakistan
Cont’d: Overview of Regional Nat-Cats (Oman 2007 & 2010) • Frequent flooding events • Cities coming to a complete halt • State of emergency • No proper disaster plan in • place (i.e. sudden evacuation) • A large cyclone (Phet) hit • the coast of Oman causing • widespread flood damage • on 5th of June, 2010 • Assumed that the event may have • cost the industry between USD • 100mn and USD 200mn: this • compares to more than USD • 500mn from Cyclone Gonu.
Statistics & Fact Figures on Oman • One of the largest recorded storms occurred in Masirah in 1977 - total rainfall was 349 mm • In Mina Al Fahal in May 1981, 91.1mm of rain fell in two hours, causing major losses • Further losses in the capital area in 1982, and in August 1983 • Losses were also in the Salalah area, but much of this was uninsured "Source : "EM-DAT: The OFDA/CRED International Disaster Database, www.emdat.be - Université catholique de Louvain - Brussels - Belgium“ “For some natural disasters (particularly floods and droughts) there is no exact day or month for the event, and for other disasters (particularly pre-1974) the available record of the disaster does not provide an exact day or month."
Overview of Regional Nat-Cats (Saudi Arabia) Earthquake : • A fault line runs down through the Red Sea making the Western seaboard extremely vulnerable • Western seaboard was the epicenter of an EQ which occurred on Nov. 22nd, 1995 affecting Egypt, Israel, Lebanon, Jordan and north-western Saudi Arabia • The most dramatic recent event occurred in 1982 (Dhamar EQ) at the southern end of the rift causing an estimated 2,800 deaths in Yemen • Saudi Arabia is regarded as aseismic in the eastern and central regions
Cont’d: Overview of Regional Nat-Cats (Saudi Arabia) Flood : • Extreme rainfall may occur • Most towns in Saudi Arabia were not built with storm drains • Jeddah is reported to still be seriously short of adequate drainage systems (some experts think that as much as SAR 33bn (USD 8.8bn) of expenditure is required to fully address the problem) • Planners did not forecast the volume of water table which lies only a meter below the surface in coastal cities like Jeddah and Dammam • The water table is even higher where land has been reclaimed from the sea • Buildings with basements require 24-hour pumping even during the summer, and some insurers exclude damage caused by underground water
Loss History in Saudi Arabia Jeddah, 2 November 1995. Two hours of torrential rain accompanied by high winds and hailstones big enough to dent cars. The wind blew down trees, lamp posts, a port crane and containers. Flood water was one meter deep in certain areas. There is no estimate of total insured losses. Riyadh, 23 March 1996. Six to seven hours of torrential rain and hail caused flooding. Several people drowned when their cars became trapped in flooded underpasses. It took a week for the flood waters to drain away. The largest single claim is believed to be SAR 12mn (USD 3.2mn). One of the leading insurers incurred total losses of SAR 17mn (USD 4.54mn).
Cont’d: Loss History in Saudi Arabia Jeddah, 24 November 2009. A major flash flood event occurred in Jeddah (said to be the worst in 27 years) following torrential rainfall of 3.5 inches (89mm) in only four hours. Total damage from this event has been conservatively estimated at about USD 933mn, of which at least USD 533mn arose from damage to infrastructure (buildings, bridges and roads). It is believed that some 122 people were killed and more than 350 people reported missing in this event. According to market sources the total cost of the event to the insurance industry is likely to have been between SAR 300mn and SAR 400mn (USD 80mn and USD 107mn). Jeddah, January 2011. Torrential rain caused flash flooding in Jeddah on 14 January 2011, when three months’ rainfall fell in the space of just a few hours. At least 10 people died and at least 112 were injured as a result and also the floods damaged 25,000 buildings, 2,500 shops and a major proportion of the city’s roads. The city’s drainage system again proved that it is not able to cope with rainstorms of this magnitude.
Saudi Arabian Market Features • It is not known whether all companies had purchased sufficient XL coverage • prior to 2010. • Direct insurers did not calculate PMLs for the different zones although • reinsurers set PMLs and monitor their treaty and facultative exposures • In 2010, new reinsurance regulations were issued stipulating annual scenario • (including flood) testing of the adequacy of per risk and per event retentions • and limits of each company to be reported on an annual basis to SAMA. • There is no known earthquake disaster plan, but there is a permanent • committee within the Civil Defense organization for disaster and catastrophe • emergency response. • The return periods for the Red Sea region are: Source : AXCO
Overview of Regional Nat-Cats (United Arab Emirates) • Three potential sources: • Local Faults (Western Coastal and Dibba Fault) Mmax: ~6 • S-Iran (Zagros Fault), Mmax: ~7.5 • Gulf of Oman (Makran Fault), Mmax: 8.0 – 8.5 • Details of the seismic hazard in the UAE: • Limited knowledge of the seismic hazard • Historical observation of the seismicity is very short • Return periods of the events and maximum magnitudes for the local sources are very difficult to assess • During the last decade several events occurred from local as well as from distant sources
Regional Seismic Hazard Map Source : “http://earthquake.usgs.gov/earthquakes/world/middle_east/gshap.php”
UAE Market Features • High vulnerability of assets due to: • High concentration of values • Very heterogeneous building stock, large variety in height and value • Building code requirements • Many dwellings are built for a short lifetime • Behavior of the construction sites in case of an EQ? • Clearly the GCC is part of the Arabian Peninsula boarded by seismically active area as experienced in the past, with other associated risks : • Liquefaction due to the nature of the soil which is mainly sand • Risk of Tsunami affecting manmade islands such as the Palms Islands
UAE Market Initiatives Source : Emirates Insurance Association
Insurance Market Reaction • The reality of exposure has led a number of reinsurance companies to curtail their involvement in the area • A better understanding of the exposure need to be present in order to attract such capacity • This would also help in obtaining a better price for the risks when such exposure can be identified • No significant impact on the availability of catastrophe reinsurance in this market • Market conditions continued to be increasingly competitive in subsequent years • Average retentions were increased in certain territories i.e. Oman subsequent to Gonu
Necessary Measures • Join efforts along with government entities to insure that a minimum level of information is available about seismic activities in the region and ensure a proper recording of such activities • To get information about the building codes and use such information in the insurance rating mechanism for the risks • The earthquake cover, as well as the STF cover, is now given automatically with the property policy. This makes it difficult for the insurance companies to measure their actual exposure towards these risks as well make it difficult for the companies to buy catastrophe covers for perils they are giving for free. • A proper zoning should be followed for the various parts of the exposed territories in the region to enable those markets to use a uniformed mapping and zoning for the reporting of their accumulations and measuring their exposures.
OtherChallenges Facing the Region • Territories exposed to EQ & Storm are being given automatic free covers • Large per risk losses • Inadequate primary rates and shrinking margins due to unhealthy competition • making potential recoveries extremely difficult • Man-made hazards such as SRCC, political violence, etc…: • - Major per risk losses estimated at USD 18.2mn – due to burning down of a supermarket, during a short period of civil unrest in Sohar • Low retentions, large capacities & the dilemma of co-insurance (unknown acc.) • Low investment returns • Moral Hazards • Lack of Awareness & the low insurance penetration 28
Cont’d: Other Challenges Facing the Region • Extension of activities beyond national borders with Cat exposed business • Regulatory requirements: • - Blood money increased from OMR 5,000 to OMR 15,000 (KSA as well inc. • from SAR 100k to SAR 300K) • - Solvency II; • - Geocoding of risks, computer models not used locally to monitor aggs. • - Improve data quality • Introduction of Event & Cession Limits • Customer Loyalty • Restrictions set by major market players (i.e. minimum line, restricted LOBs) • Placements made on a bouquet basis • New comers providing additional facilities to increase capacity 29
Recommendations • Merger / acquisition / significant increase in capital base • Regional Insurance market environment requires development of models with ongoing • improvements • Synergy between scientists and the insurance industry is required • Reinsurers committed to these markets must contribute by providing necessary • expertise • New entrants and/or intermediaries must also add value to the industry: • Propose risk management measures and solutions • Support in developing improved systems to improve quality of data output • Utilize computer simulation models to: • - Perform as-if calculations for alternative retentions reinsurance programme • structure (combination of proportional and non-proportional reinsurance) • - Test the options considered and see bottom line effect on retained account • results (demonstration to be given) • - Brokers can help insurers better understand market conditions on what can • be feasible and what cannot i.e. minimizing or maximizing retention may not • always work; the optimum is where both sides meet