Download
1 / 1
10 likes | 133 Views
Drift Time Calibration & Gas Monitoring of the ATLAS Muon Spectrometer Precision Chambers. . Daniel S. Levin, 1 Nir Amram 2, Meny ben Moshe 2 , Erez Etzion 2 , Tiesheng Dai 1 , Edward Diehl 1 ,

E N D
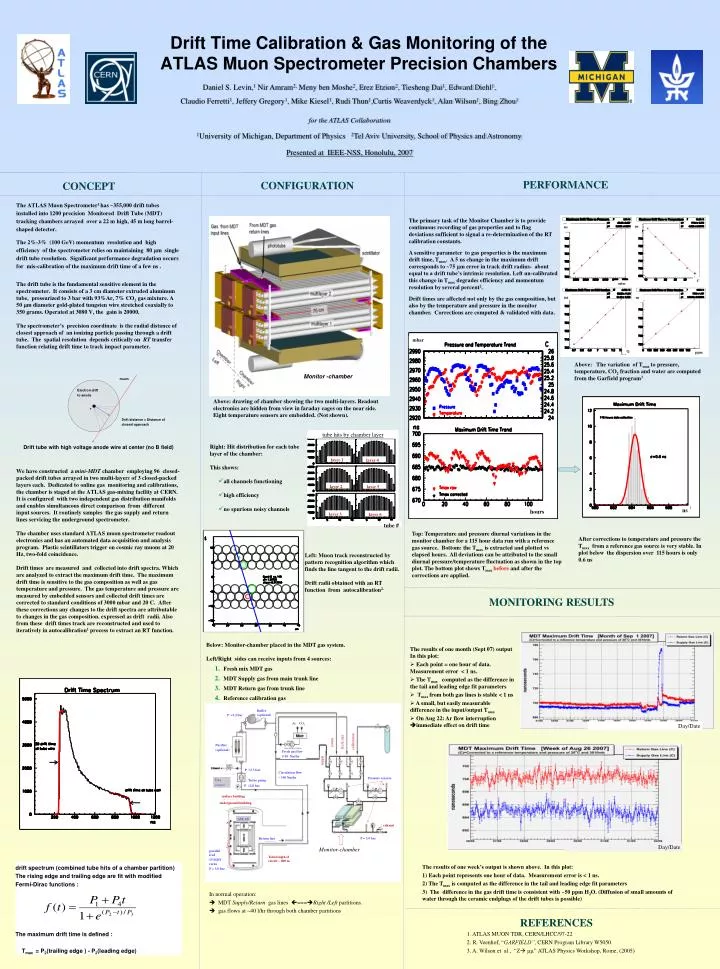
Drift Time Calibration & Gas Monitoring of the ATLAS Muon Spectrometer Precision Chambers  Daniel S. Levin,1 Nir Amram2,Menyben Moshe2, Erez Etzion2, Tiesheng Dai1, Edward Diehl1, Claudio Ferretti1, Jeffery Gregory1, Mike Kiesel1, Rudi Thun1,Curtis Weaverdyck1, Alan Wilson1, Bing Zhou1 for the ATLAS Collaboration 1University of Michigan, Department of Physics 2Tel Aviv University, School of Physics and Astronomy Presented at IEEE-NSS, Honolulu, 2007 The ATLAS Muon Spectrometer1 has ~355,000 drift tubes installed into 1200 precision Monitored Drift Tube (MDT) tracking chambers arrayed over a 22 m high, 45 m long barrel-shaped detector. The 2%-3% (100 GeV) momentum resolution and high efficiency of the spectrometer relies on maintaining 80 mm single drift tube resolution. Significant performance degradation occurs for mis-calibration of the maximum drift time of a few ns . The drift tube is the fundamental sensitive element in the spectrometer. It consists of a 3 cm diameter extruded aluminum tube, pressurized to 3 bar with 93%Ar, 7% CO2 gas mixture. A 50 mm diameter gold-plated tungsten wire stretched coaxially to 350 grams. Operated at 3080 V, the gain is 20000. The spectrometer’s precision coordinate is the radial distance of closest approach of an ionizing particle passing through a drift tube. The spatial resolution depends critically on RT transfer function relating drift time to track impact parameter. We have constructed a mini-MDT chamber employing 96 closed-packed drift tubes arrayed in two multi-layers of 3 closed-packed layers each. Dedicated to online gas monitoring and calibrations, the chamber is staged at the ATLAS gas-mixing facility at CERN. It is configured with two independent gas distribution manifolds and enables simultaneous direct comparison from different input sources. It routinely samples the gas supply and return lines servicing the underground spectrometer. The chamber uses standard ATLAS muon spectrometer readout electronics and has an automated data acquisition and analysis program. Plastic scintillators trigger on cosmic ray muons at 20 Hz, two-fold coincidence. Drift times are measured and collected into drift spectra. Which are analyzed to extract the maximum drift time. The maximum drift time is sensitive to the gas composition as well as gas temperature and pressure. The gas temperature and pressure are measured by embedded sensors and collected drift times are corrected to standard conditions of 3000 mbar and 20 C. After these corrections any changes to the drift spectra are attributable to changes in the gas composition. expressed as drift radii. Also from these drift times track are reconstructed and used to iteratively in autocalibration1 process to extract an RT function. PERFORMANCE CONFIGURATION CONCEPT The primary task of the Monitor Chamber is to provide continuous recording of gas properties and to flag deviations sufficient to signal a re-determination of the RT calibration constants. A sensitive parameter to gas properties is the maximum drift time, Tmax. A 5 ns change in the maximum drift corresponds to ~75 mm error in track drift radius- about equal to a drift tube’s intrinsic resolution. Left un-calibrated this change in Tmax degrades efficiency and momentum resolution by several percent2. Drift times are affected not only by the gas composition, but also by the temperature and pressure in the monitor chamber. Corrections are computed & validated with data. ns ns C mbar ns ns mbar % ppm Above: The variation of Tmax to pressure, temperature, CO2 fraction and water are computed from the Garfield program3 Monitor -chamber muon Electron drift to anode Above: drawing of chamber showing the two multi-layers. Readout electronics are hidden from view in faraday cages on the near side. Eight temperature sensors are embedded. (Not shown). + Drift distance = Distance of closest approach tube hits by chamber layer Drift tube with high voltage anode wire at center (no B field) Right: Hit distribution for each tube layer of the chamber: This shows: • all channels functioning • high efficiency • no spurious noisy channels layer 1 layer 4 layer 2 layer 5 ns hours layer 3 layer 6 tube # Top: Temperature and pressure diurnal variations in the monitor chamber for a 115 hour data run with a reference gas source. Bottom: the Tmax is extracted and plotted vs elapsed hours. All deviations can be attributed to the small diurnal pressure/temperature fluctuation as shown in the top plot. The bottom plot shows Tmax before and after the corrections are applied. After corrections to temperature and pressure the Tmax from a reference gas source is very stable. In plot below the dispersion over 115 hours is only 0.6 ns Left: Muon track reconstructed by pattern recognition algorithm which finds the line tangent to the drift radii. Drift radii obtained with an RT function from autocalibration2. MONITORING RESULTS The results of one month (Sept 07) output In this plot: • Each point = one hour of data. Measurement error < 1 ns. • The Tmax computed as the difference in the tail and leading edge fit parameters • Tmax from both gas lines is stable < 1 ns • A small, but easily measurable difference in the input/output Tmax • On Aug 22: Ar flow interruption immediate effect on drift time Below: Monitor-chamber placed in the MDT gas system. Left/Right sides can receive inputs from 4 sources: • Fresh mix MDT gas • MDT Supply gas from main trunk line • MDT Return gas from trunk line • Reference calibration gas Buffer (optional) P =3.2 bar Ar CO2 Day/Date return fresh mix calibration Purifier (optional) Fresh gas flow 5-10 Nm/hr supply P =3.3 bar Circulation flow ~ 100 Nm/hr Turbo pump Pressure sensors Freq control P =2.8 bar surface building underground building ATLAS exhaust parallel feed 15 MDT racks P = 3.0 bar P = 3.0 bar Return line Day/Date Monitor-chamber Total length of circuit ~ 800 m The results of one week’s output is shown above. In this plot: • Each point represents one hour of data. Measurement error is < 1 ns. • The Tmax is computed as the difference in the tail and leading edge fit parameters • The difference in the gas drift time is consistent with ~50 ppm H2O. (Diffusion of small amounts of water through the ceramic endplugs of the drift tubes is possible) drift spectrum (combined tube hits of a chamber partition) The rising edge and trailing edge are fit with modified Fermi-Dirac functions : The maximum drift time is defined : Tmax = P2(trailing edge ) - P2(leading edge) In normal operation: MDT Supply/Return gas lines ===Right /Left partitions. gas flows at ~40 l/hr through both chamber partitions REFERENCES 1. ATLAS MUON TDR, CERN/LHCC/97-22 2. R. Veenhof, “GARFIELD”, CERN Program Library W5050. 3. A. Wilson et al , “Z mm”ATLAS Physics Workshop, Rome, (2005)