Download
1 / 19
190 likes | 292 Views
Special Distributions. The Normal Probability Distribution - a special kind of continuous probability distribution. The Normal Distribution. f(x) - x. The Normal Distribution. The Mathematical Model. f ( X ) = frequency of random variable X

E N D
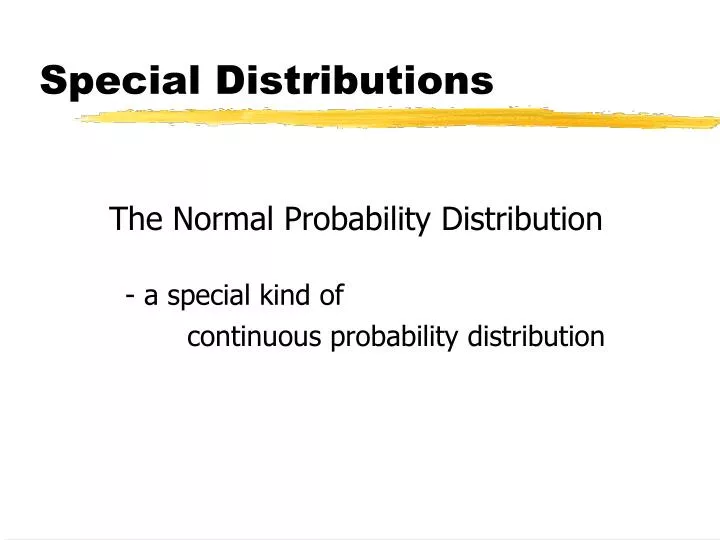
Special Distributions The Normal Probability Distribution - a special kind of continuous probability distribution
The Normal Distribution f(x) - x
The Mathematical Model f(X) = frequency of random variable X = 3.14159; e = 2.71828 = population standard deviation X = value of random variable (- < X < ) = population mean
Finding Normal Probabilities Via Integral calculus: Given X ~ N (, ), find P(a X b) = f(x) dx a b
Finding Normal Probabilities Via Standard Normal Probability Tables: - convert the unstandardized normal random variable, X, to a standardized normal random variable, Z, via the transformation: Z = X - where Z ~ N (, )
Example: X ~ N ( = 410, = 60) 1. Find P(X 300) 300 =410
Example: P(X 300) = P[(X - )/ (300 – 410)/60] = P[Z -1.83] -1.83 =0
The Standard Normal Table Z .00 .01 .02 .03 .04 .05 .06 .07 .08 .09 0.0 0.1 0.2 0.3 . . . 1.8 .4664
Example: P(X 300) = P[(X - )/ (300 – 410)/60] = P[Z -1.83] = .0336 .5-.4664=.0336 .4664 -1.83 =0
Example: X ~ N ( = 410, = 60) 2. Find P(350 X 450) 350 =410 450
Example: P(350 X 450) = P[(350 - 410)/60 (X - )/ (450 – 410)/60] = P[-1.00 Z .67] = .3413 + .2485 = .5899 .3413 .2486 -1.00 =0 .67
Example: X ~ N ( = 410, = 60) 3. Find the 95th percentile 95%5% =410 xo
Example: The 95th percentile in z-score form: 95%5% =0 zo
Example: The 95th percentile in z-score form: 45% = .4500 95%5% =0 zo
The Standard Normal Table Z .00 .01 .02 .03 .04 .05 .06 .07 .08 .09 0.0 0.1 0.2 0.3 . . . 1.6 .4495 .4505
Example: The 95th percentile in z-score form: 45% = .4500 95%5% =0 zo = 1.65
Example: The 95th percentile in X-score form: X = + Z = 410 + 60(1.65) = 509
Example: X ~ N ( = 410, = 60) Find the Interquartile Range