Download
1 / 17
170 likes | 173 Views
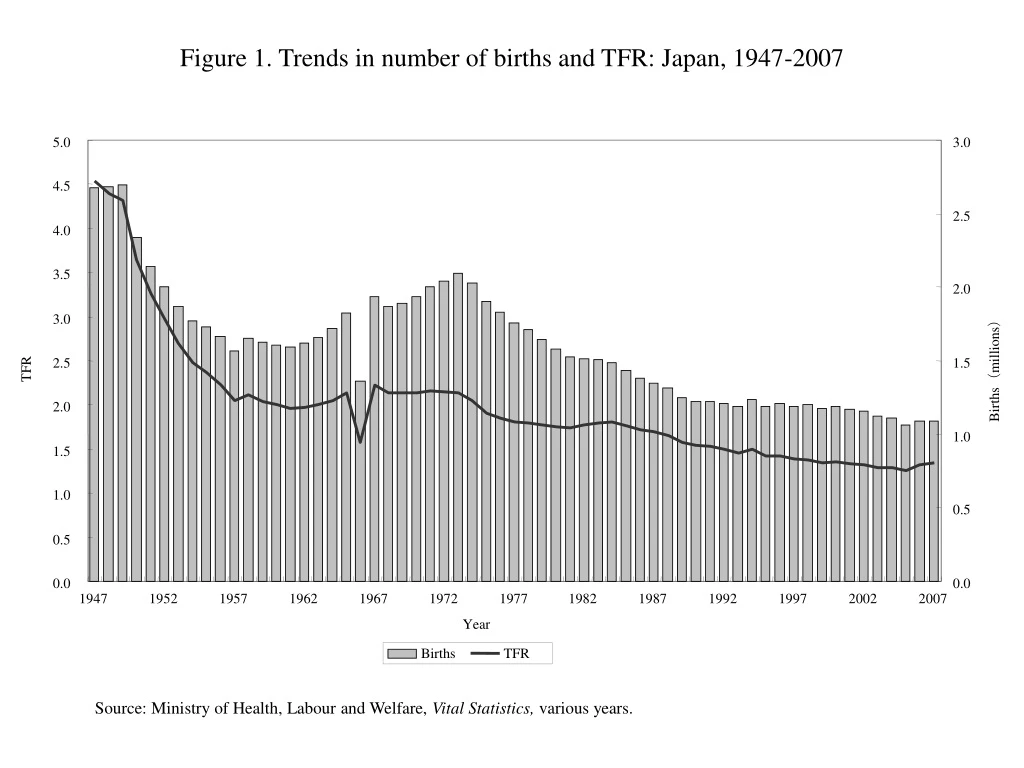
Figure 1. Trends in number of births and TFR: Japan, 1947-2007. 5.0. 3.0. 4.5. 2.5. 4.0. 3.5. 2.0. 3.0. Births ( millions ). TFR. 2.5. 1.5. 2.0. 1.0. 1.5. 1.0. 0.5. 0.5. 0.0. 0.0. 1947. 1952. 1957. 1962. 1967. 1972. 1977. 1982. 1987. 1992. 1997. 2002. 2007. Year.

E N D
Figure 1. Trends in number of births and TFR: Japan, 1947-2007 5.0 3.0 4.5 2.5 4.0 3.5 2.0 3.0 Births(millions) TFR 2.5 1.5 2.0 1.0 1.5 1.0 0.5 0.5 0.0 0.0 1947 1952 1957 1962 1967 1972 1977 1982 1987 1992 1997 2002 2007 Year Births TFR Source: Ministry of Health, Labour and Welfare, Vital Statistics, various years.
Figure2. Real GDP growth rate and total fertility rate: Japan, 1947-2007 5.0 15 Korean war High economic growth 13 4.5 11 Vogel’s “Japan as No. 1” published 4.0 9 Bursting of the bubble economy 3.5 7 TFR 5 3.0 Growth rate (%) “Lost Decade” 3 2.5 1 2.0 -1 1.5 -3 1.0 -5 1947 1952 1957 1962 1967 1972 1977 1982 1987 1992 1997 2002 2007 Year TFR GDP growth rate
Figure 3. Labor force participation rates for men and women aged 65 and over in selected countries, 2007 (%) 35 30 25 20 Men Women 15 10 5 0 France Germany Austria United States Japan Source: ILO, 2008, Yearbook of Labour Statistics 2008.
Figure 4. Age-specific profiles of per capita consumption and production: Japan, 1984-2004 6 Labor income 2004 Labor income 1999 5 Labor income 1994 4 Labor income 1989 Consumption 2004 Consumption 1999 Labor income 1984 Million yen (measured in 2000 constant prices) 3 Consumption 1994 Consumption 1989 2 Consumption 1984 1 0 0 5 10 15 20 25 30 35 40 45 50 55 60 65 70 75 80 85 90+ Age
Figure 5. Average age-specific profiles of per capita yearly consumption and production, 1984-2004 6 5 Production 4 3 Million yen 2 Consumption 1 0 0 5 10 15 20 25 30 35 40 45 50 55 60 65 70 75 80 85 90+ Age
Figure 7. Social security costs by category (as a percentage of national income), 1951-2006, Japan (%) 30 25 20 Welfare and other expenditures 15 10 Pension 5 Medical care 0 1951 1956 1961 1966 1971 1976 1981 1986 1991 1996 2001 2006 Year Source: National Institute of Population and Social Security Research, 2008, Social Security Benefits for Fiscal Year 2006, http://www.ipss.go.jp/.
Figure 8. International comparison of the proportion of the elderly persons aged 65 and over living in three-generation households: selected countries, 1981-2005 (%) 45 40 35 Japan 30 25 20 15 10 France Germany France 5 USA 0 1981 1986 1990 1996 2001 2005 Year Source: Cabinet Office, International Survey of Lifestyles and Attitudes of the Elderly, various years.
Figure 9. Changing pattern of three components of per capita reallocation of lifecycle deficits in Japan Panel A: 1984
Figure 9. Changing pattern of three components of per capita reallocation of lifecycle deficits in Japan Panel B: 1994
Figure 9. Changing pattern of three components of per capita reallocation of lifecycle deficits in Japan Panel C: 2004
Figure 10. Per capita net public pension transfers, Japan 2.0 1.5 1.0 1984 Million yen (2000 constant prices) 1989 0.5 1994 1999 2004 0.0 -0.5 -1.0 0 10 20 30 40 50 60 70 80 90+ Age
Figure 11. Per capita net intra-household transfers in 2004, by age
Year Total population (1000 persons) 0-14(%) 65+(%) Total Fertility Rate Total Dependency Ratio 75+/65+(%) Women 40-59/65-84 1950 83200 35.4 4.9 3.65 67.5 25.7 1.82 1955 89276 33.4 5.3 2.37 63.1 29.2 1.81 1960 93419 33.0 5.7 2.00 60.4 30.4 1.80 1965 98275 25.6 6.3 2.14 46.8 30.3 1.77 1970 103720 23.9 7.1 2.13 44.9 30.2 1.69 1975 111940 24.3 7.9 1.91 47.6 32.0 1.60 1980 117060 23.5 9.1 1.75 48.4 34.4 1.48 1985 121049 21.5 10.3 1.76 46.7 37.8 1.40 1990 123611 18.2 12.1 1.54 43.5 40.1 1.30 1995 125570 16.0 14.6 1.42 50.4 39.3 1.10 2000 126926 14.6 17.4 1.36 46.9 40.9 0.91 2005 127449 13.8 20.2 1.25 50.6 45.1 0.77 2010 127013 13.0 23.0 1.24 55.6 48.0 0.65 2015 125603 12.1 26.9 1.24 63.2 48.4 0.59 2020 123235 11.0 29.5 1.24 67.6 52.1 0.57 2025 120094 10.2 31.0 1.28 70.0 60.0 0.56 Sources: Statistics Bureau, Population Census, various year. Nihon University Population Research Institute Population Projection, 2003 Table 1. Population change in Japan: 1950-2025
Table 2. Income sources for the elderly aged 65 and older in Japan: 1981,1986, 1990, 1996, 2001, and 2005 (%) Source: Cabinet Office, International Survey of Lifestyles and Attitudes of the Elderly, various years.
Table 3. Change in crossing ages in per capita net familial transfers in Japan, 1984-2004
Table 4. Change in crossing ages in per capita net public transfers in Japan, 1984-2004