Download
1 / 16
160 likes | 251 Views
Visualizing the Bureau of Labor Statistics Employment Dataset by Siva Mohan and Curran Kelleher. Outline. Understanding the Dataset Data Preparation Visualizations Issues. Understanding the Dataset as dimensions and measures. Raw data at ftp://ftp.bls.gov/pub/special.requests/cew/

E N D
Visualizing theBureau of Labor Statistics Employment Dataset bySiva Mohan and Curran Kelleher
Outline • Understanding the Dataset • Data Preparation • Visualizations • Issues
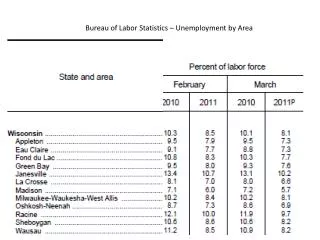
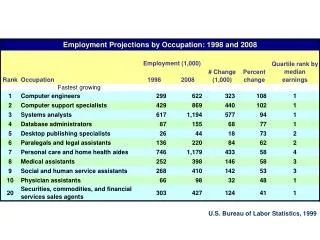
Understanding the Datasetas dimensions and measures • Raw data at ftp://ftp.bls.gov/pub/special.requests/cew/ • Covers Time from 1990 to 2007 • Data for years, quarters, and months • Covers Space for all US States • Data for States and Counties • Covers the NAICS Industry hierarchy • Covers Ownership • Government (Federal, State, Local) and Private • Contains measures employment, annual pay, total wages, and number of establishments (among others)
NAICSNorth American Industry Classification System • 11 Agriculture, Forestry, Fishing and Hunting • 111 Crop Production • 1111 Oilseed and Grain Farming • 11111 Soybean Farming • 111110 Soybean Farming • 11112 Oilseed (except Soybean) Farming • 111120 Oilseed (except Soybean) Farming • 11113 Dry Pea and Bean Farming • 111130 Dry Pea and Bean Farming • 11114 Wheat Farming • 111140 Wheat Farming • 11115 Corn Farming • 111150 Corn Farming • 11116 Rice Farming • 111160 Rice Farming • 11119 Other Grain Farming • 111191 Oilseed and Grain Combination Farming • 111199 All Other Grain Farming • 1112 Vegetable and Melon Farming • 11121 Vegetable and Melon Farming • 111211 Potato Farming • 111219 Other Vegetable (except Potato) and Melon Farming • 1113 Fruit and Tree Nut Farming • 11131 Orange Groves • 111310 Orange Groves • ...
Data Preprocessing • We wrote shell scripts to • Download all raw data files via FTP • Parse the raw data files (BLS fixed width format) • Import the raw data files into a MySQL database • We manually imported tables mapping • BLS “Area Code” → state name • BLS “Area Code” → state abbreviation • Necessary for using Tableau's map feature • NAICS code → industry name • BLS Ownership code → ownership name
Issues • No support for hierarchical data cubes • With this we could have seen the whole dataset • County data too large for Tableau (1 min per vis) • Hierarchical time was (seemingly) impossible • Years in different tables, months in different columns • Tableau expects each dimension as a single column • We did not document as we went, had to backtrack • “Cancel” query in Tableau didn't stop queries • Overlapping labels occurred often • (seemingly) impossible to probe with many dimensions