Download
1 / 98
1.04k likes | 1.35k Views
Clinical Development Program. Anne B. Cropp, Pharm.D. Global Clinical Leader. Agenda. Clinical Development Program Overview Clinical Pharmacology Efficacy Safety. Agenda. Clinical Development Program Overview Clinical Pharmacology Efficacy Safety. 1993. 1994. 1995. 1996. 1997.

E N D
Clinical Development Program Anne B. Cropp, Pharm.D. Global Clinical Leader
Agenda • Clinical Development Program Overview • Clinical Pharmacology • Efficacy • Safety
Agenda • Clinical Development Program Overview • Clinical Pharmacology • Efficacy • Safety
1993 1994 1995 1996 1997 1998 1999 2000 2001 2002 2003 2004 2005 Clinical Development Program IND 43313 EOP 2 FDA Interactions Pre-NDA NDA Phase 1 Phase 1 StudiesDevelopmental Phase 1 Studies Final Formulation Phase 2 102 102 E 1036 103 103 E Exploratory 104 104 E 106 107 Phase 3 Group I 111 108 109 110 1009 Efficacy 1001/1002 1026 Phase 3 Group II 1027 10221029 Long-term Safety 1028 1030 Phase 3b 1017
Demographic Characteristics:INH-treated Adults in All Phase 2/3 Studies
Duration of Exposure: INH-treated Adults in All Phase 2/3 Studies
Agenda • Clinical Development Program Overview • Clinical Pharmacology • Efficacy • Safety
Clinical Pharmacology Studies Using the Phase 3 Formulation of INH
Clinical Pharmacology • Bioavailability is approximately 10% relative to SC • Absorbed more rapidly than SC regular insulin and as rapidly as SC insulin lispro • Dose-separated and dose-linear exposure over 1 to 6 mg • Three 1 mg blisters should not be substituted for one 3 mg blister • Age, gender, race, and BMI have no effects on PK • Smoking increases absorption rate and extent • Bioavailability higher in COPD, lower in asthma • Intra-subject variability of PK and PD comparable to SC regular insulin in subjects with DM
~30% retained in blister/device ~20% deposited in oropharynx ~10% tracheobronchial ~40% to alveolar spaces Insulin absorption site Enzymatic degradation No preclinical or clinical evidence for accumulation Oral Inhalation of INH Bioavailability 10% Relative to SC Insulin
Clinical Pharmacology • Bioavailability is approximately 10% relative to SC • Absorbed more rapidly than SC regular insulin and as rapidly as SC insulin lispro • Dose-separated and dose-linear exposure over 1 to 6 mg • Three 1 mg blisters should not be substituted for one 3 mg blister • Age, gender, race, and BMI have no effects on PK • Smoking increases absorption rate and extent • Bioavailability higher in COPD, lower in asthma • Intra-subject variability of PK and PD comparable to SC regular insulin in subjects with DM
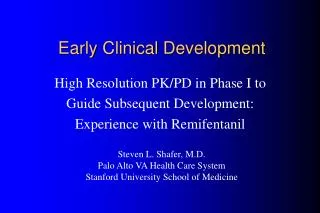
INH Absorbed More Rapidly than SC Regular; as Rapidly as SC Lispro - Study 017 100 INH 6 mg Insulin lispro 18 U Regular insulin 18 U 80 60 Mean Glucose Infusion Rate (% of Maximum) 40 20 0 0 60 120 180 240 300 360 420 480 540 600 Time (min) Diabetologia 2000;43(Suppl 1):A46.
Clinical Pharmacology • Bioavailability is approximately 10% relative to SC • Absorbed more rapidly than SC regular insulin and as rapidly as SC insulin lispro • Dose-separated and dose-linear exposure over 1 to 6 mg • Three 1 mg blisters should not be substituted for one 3 mg blister • Age, gender, race, and BMI have no effects on PK • Smoking increases absorption rate and extent • Bioavailability higher in COPD, lower in asthma • Intra-subject variability of PK and PD comparable to SC regular insulin in subjects with DM
Linear Increase in AUC with INH Dose Individual AUC values Arithmetic means 2 x 3 mg 1 x 1 mg + 1 x 3 mg AUC 0-600 (µU.min/mL) 3 mg 2 x 1 mg 1 mg Dose (mg) Study 1012
Clinical Pharmacology • Bioavailability is approximately 10% relative to SC • Absorbed more rapidly than SC regular insulin and as rapidly as SC insulin lispro • Dose-separated and dose-linear exposure over 1 to 6 mg • Three 1 mg blisters should not be substituted for one 3 mg blister • Age, gender, race, and BMI have no effects on PK • Smoking increases absorption rate and extent • Bioavailability higher in COPD, lower in asthma • Intra-subject variability of PK and PD comparable to SC regular insulin in subjects with DM
3x1 mg 1x3 mg 3 X 1 mg 1 X 3 mg Median Changes in Concentrations of Serum Insulin Over Time by Treatment Ratio AUC 140% (90% Cl 117-167%) Ratio Cmax 127% (90% Cl 108-148%) Median Concentration (uU/ml) Time (minutes)
Clinical Pharmacology • Bioavailability is approximately 10% relative to SC • Absorbed more rapidly than SC regular insulin and as rapidly as SC insulin lispro • Dose-separated and dose-linear exposure over 1 to 6 mg • Three 1 mg blisters should not be substituted for one 3 mg blister • Age, gender, race, and BMI have no effects on PK • Smoking increases absorption rate and extent • Bioavailability higher in COPD, lower in asthma • Intra-subject variability of PK and PD comparable to SC regular insulin in subjects with DM
Clinical Pharmacology • Bioavailability is approximately 10% relative to SC • Absorbed more rapidly than SC regular insulin and as rapidly as SC insulin lispro • Dose-separated and dose-linear exposure over 1 to 6 mg • Three 1 mg blisters should not be substituted for one 3 mg blister • Age, gender, race, and BMI have no effects on PK • Smoking increases absorption rate and extent • Bioavailability higher in COPD, lower in asthma • Intra-subject variability of PK and PD comparable to SC regular insulin in subjects with DM
Agenda • Clinical Development Program Overview • Clinical Pharmacology • Efficacy • Safety
1993 1994 1995 1996 1997 1998 1999 2000 2001 2002 2003 2004 2005 Clinical Development Program IND 43313 EOP 2 FDA Interactions Pre-NDA NDA Phase 1 StudiesDevelopmental Phase 1 Studies Final Formulation Phase 1 102 102 E Phase 2 1036 103 103 E Exploratory 104 104 E 106 107 111 108 109 Phase 3 Group I 110 1009 Efficacy 1001/1002 1026 1027 Phase 3 Group II 10221029 Long-term Safety 1028 1030 Phase 3b 1017
1993 1994 1995 1996 1997 1998 1999 2000 2001 2002 2003 2004 2005 Clinical Development Program IND 43313 EOP 2 FDA Interactions Pre-NDA NDA Phase 1 StudiesDevelopmental Phase 1 Studies Final Formulation Phase 1 102 102 E Phase 2 1036 103 103 E Exploratory 104 104 E 106 107 Type 1 DM Intensive 107 1022 1026 1027 Standard 102 106 1009 111 108 109 Phase 3 Group I 110 1009 Efficacy 1001/1002 1026 1027 Phase 3 Group II 1022 1029 Long-term Safety 1028 1030 Phase 3b 1017
1993 1994 1995 1996 1997 1998 1999 2000 2001 2002 2003 2004 2005 Clinical Development Program IND 43313 EOP 2 FDA Interactions Pre-NDA NDA Phase 1 StudiesDevelopmental Phase 1 Studies Final Formulation Phase 1 102 102 E Phase 2 1036 103 103 E Exploratory 104 104 E 106 107 Type 2 DM Insulin Using INH Rx Basal-bolus 103 108 1029 111 108 109 Phase 3 Group I 110 1009 Efficacy 1001/1002 1026 1027 Phase 3 Group II 10221029 Long-term Safety 1028 1030 Phase 3b 1017
1993 1994 1995 1996 1997 1998 1999 2000 2001 2002 2003 2004 2005 Clinical Development Program IND 43313 EOP 2 FDA Interactions Pre-NDA NDA Phase 1 StudiesDevelopmental Phase 1 Studies Final Formulation Phase 1 102 102 E Phase 2 1036 103 103 E Exploratory 104 104 E 106 107 Type 2 DM Oral Agents INH Rx INH alone 109 110 INH + OA 104 109 1001/1002 111 108 109 Phase 3 Group I 110 1009 Efficacy 1001/1002 1026 1027 Phase 3 Group II 1022 1029 Long-term Safety 1028 1030 Phase 3b 1017
102 Primary Endpoint: HbA1c Change from BaselineMean Treatment Group Differences, 95% CI Favors INH Favors Comp Type 1 Adjusted Treatment Group Differences (INH-Comparator) in Change from Baseline in HbA1c(%)
Primary Endpoint: HbA1c Change from BaselineMean Treatment Group Differences, 95% CI Favors INH Favors Comp 102 Type 1 106 (18 years) 107 (18 years) Adjusted Treatment Group Differences (INH-Comparator) in Change from Baseline in HbA1c(%)
Type 1 Type 2 Insulin Using 102 106 (18 years) 107 (18 years) 103 Primary Endpoint: HbA1c Change from BaselineMean Treatment Group Differences, 95% CI Favors INH Favors Comp Adjusted Treatment Group Differences (INH-Comparator) in Change from Baseline in HbA1c(%)
Type 1 Type 2 Insulin Using 102 106 (18 years) 107 (18 years) 103 108 Primary Endpoint: HbA1c Change from BaselineMean Treatment Group Differences, 95% CI Favors INH Favors Comp Adjusted Treatment Group Differences (INH-Comparator) in Change from Baseline in HbA1c(%)
Type 1 Type 2 Insulin Using Type 2 Non-Insulin Using 102 106 (18 years) 107 (18 years) 103 108 104 Primary Endpoint: HbA1c Change from BaselineMean Treatment Group Differences, 95% CI Favors INH Favors Comp Adjusted Treatment Group Differences (INH-Comparator) in Change from Baseline in HbA1c(%)
Type 1 Type 2 Insulin Using Type 2 Non-Insulin Using 102 106 (18 years) 107 (18 years) 103 108 104 109 (INH vs. OA) 109 (INH + OA vs. OA) 1001 High Stratum 1002 High Stratum 110 Primary Endpoint: HbA1c Change from BaselineMean Treatment Group Differences, 95% CI Favors INH Favors Comp Adjusted Treatment Group Differences (INH-Comparator) in Change from Baseline in HbA1c(%)
Type 1 Type 2 Insulin Using Type 2 Non-Insulin Using Primary Endpoint: HbA1c Change from BaselineMean Treatment Group Differences, 95% CI Favors INH Favors Comp 102 106 (18 years) 107 (18 years) 103 108 104 109 (INH vs. OA) 109 (INH + OA vs. OA) 1001 High Stratum 1001 Low Stratum 1002 High Stratum 1002 Low Stratum 110 Adjusted Treatment Group Differences (INH-Comparator) in Change from Baseline in HbA1c(%)
1993 1994 1995 1996 1997 1998 1999 2000 2001 2002 2003 2004 2005 Clinical Development Program IND 43313 EOP 2 FDA Interactions Pre-NDA NDA Phase 1 StudiesDevelopmental Phase 1 Studies Final Formulation Phase 1 102 102 E Phase 2 1036 103 103 E Exploratory 104 104 E 106 107 111 108 109 Phase 3 Group I 110 1009 Efficacy 1001/1002 1026 1027 Phase 3 Group II 1022 1029 Long-term Safety 1028 1030 Phase 3b 1017
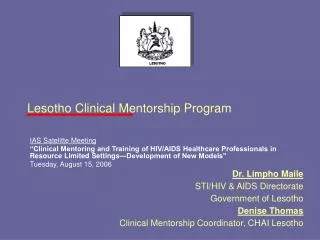
INH SC Insulin Efficacy Sustained Over 2 Years - Type 1 DMHbA1C Secondary Endpoint - Study 1022 INH-SC (95% CI): Month 12 0.27 (0.14, 0.40) Month 24 LOCF 0.25 (0.11, 0.39) Mean HbA1c % (SD) Mean HbA1c % (SD) Baseline LOCF Months INH N 276 261 249 238 234 230 221 209 288 SC N 280 274 266 260 253 237 230 219 286
INH SC Insulin Efficacy Sustained Over 2 Years – Type 2 DM Insulin Using HbA1C Secondary Endpoint – Study 1029 INH-SC (95% CI): Month 12 0.08 (-0.06, 0.22) Month 24 LOCF 0.09 (-0.07, 0.25) Mean HbA1c % (SD) Baseline LOCF Months INH N 296 279 269 259 249 244 235 224 314 SC N 292 288 281 263 253 240 238 231 303
Efficacy Sustained Over 2 Years – Type 2 DM Oral Agents HbA1C Secondary Endpoint – Study 1001/1002 Mean HbA1c % (SD) Baseline INH N 156 156 157 155 OA N 143 142 141 141
Prospective Pharmacodynamic Study in Type 1 DM Using Intensive Insulin Regimen - Study 1026 Maximum Postprandial Glucose Concentration (mg/dL) (Mean +/- SD) Baseline Week 12 Week 24 INH N = 23 23 22 SC N = 20 20 18 Heise T, Bott S, Tusek C, et al. The effect of insulin antibodies on the metabolic action of inhaled and subcutaneous insulin. Diabetes Care 2005;28:2161-9
Diabetes Treatment SatisfactionType 1 DM - Study 107, Intensive Insulin Regimen Worsened Improved Burden Convenience Flexibility Hassle Interference Pain Social Regimen Outcomes Efficacy Side Effects Net Benefit Preference Advocacy General Satisfaction Satisfaction Score: Mean Change (Baseline to Month 6) Standardized Treatment Satisfaction Scale ranges from 0 to 100.
Diabetes Treatment SatisfactionType 2 DM - Study 109 Worsened Improved Burden Convenience Flexibility Hassle Interference Pain Social Regimen Outcomes Efficacy Side Effects Net Benefit Preference Advocacy General Satisfaction Satisfaction Score: Mean Change (Baseline to Month 6) Standardized Treatment Satisfaction Scale ranges from 0 to 100.
Efficacy • As effective as SC regular insulin in the treatment of patients with type 1 and insulin requiring type 2 DM • Effective in type 2 DM used alone, in combination with basal insulin, and in combination with oral agent • Sustained efficacy • INH is patient - preferred therapy
Agenda • Clinical Development Program Overview • Clinical Pharmacology • Efficacy • Safety
Safety • Adverse Events, Serious Adverse Events, and Deaths • Hypoglycemia • Pulmonary Safety • Insulin Antibodies
Adverse Events - All CausalityPatients with Type 1 DM - Controlled Phase 2/3 Studies
Adverse Events - All CausalityPatients with Type 2 DM - Controlled Phase 2/3 Studies
Serious Adverse Events – All Causality Controlled Phase 2/3 Studies
Deaths 32 Total Deaths 4 Deaths >30 days of Dose INH: 1 Comparator: 3 28 Deaths During or 30 days of Dose Uncontrolled Extensions INH: 12/1449 (0.41*) Comparator: 0/45 (N/A*) Controlled Phase 2/3 INH: 9/1977 (0.44*) Comparator: 7/2012 (0.35*) *Incidence Rate: Deaths/1000 Subject-Months
Safety • Adverse Events, Serious Adverse Events, and Deaths • Hypoglycemia • Pulmonary Safety • Insulin Antibodies
Hypoglycemic Events Controlled Phase 2/3 Studies Proportion of Patients Reporting Hypoglycemia INH Comparator Events/Subject-Month N=691 N=686 N=487 N=480 N=757 N=617 Type 1 Type 2 Insulin Using at Entry Type 2 Non-Insulin Using at Entry
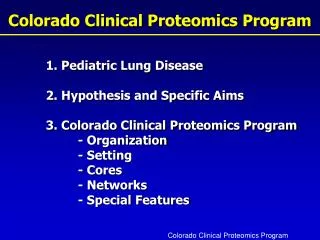
HbA1C and Hypoglycemic Events in Studies Using Intensive Insulin Regimens - Studies 107, 1022, 1026, and 1027 Mean Baseline and End-of-Study HbA1c (%) Protocol-defined SHE INH FDA-defined HE INH FDA-defined HE SC Protocol-defined SHE SC w Events/100 Subject-Months w/o Events/Subject-Month 107 1022 1026 1027 pooled 107 1022 1026 1027 pooled w, w/o= with, without subject 7988
INH SC Insulin Hypoglycemic Event Rates in Patients with Type 1 DM – Presented by Duration of Study Participation Controlled Phase 2/3 Studies Events/ Subject-month Weeks since Randomization INH N 685 672 658 613 602 581 265 256 254 249 245 242SC N 683 674 665 624 616 603 283 271 269 268 264 263