Download
1 / 21
210 likes | 382 Views
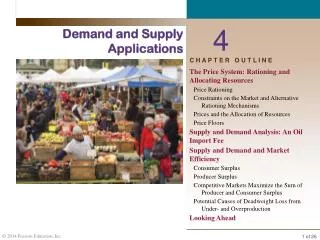
Demand and Supply Applications. The Price System: Rationing and Allocating Resources. The market system, performs two important and closely related functions: Resource allocation: the market system determines the allocation of resources among produce r s and the final mix of outputs.

E N D
The Price System:Rationing and Allocating Resources • The market system, performs two important and closely related functions: • Resource allocation: the market system determines the allocation of resources among producers and the final mix of outputs.
The Price System:Rationing and Allocating Resources • The market system, performs two important and closely related functions: • Price rationing: the market system distributes goods and services on the basis of willingness and ability to pay.
Price Rationing • A decrease in supply creates a shortage at the original price. • The lower supply is rationed to those who are willing and able to pay the higher price.
Price Rationing • There is some price that will clear any market. • The price of a rare painting will eliminate excess demand until there is only one bidder willing to buy the single available painting.
Constraints on the Market • A price ceiling is a maximum price that sellers may charge for a good, usually set by government. • In 1974, the government set a price ceiling to distribute the available supply of gasoline. • At an imposed price of 57 cents per gallon, the result was excess demand.
Alternative Rationing Mechanisms • Queuing is a nonprice rationing system that uses waiting in line as a means of distributing goods and services.
Alternative Rationing Mechanisms • Favored customers are those who receive special treatment from dealers during situations when there is excess demand. • Ration coupons are tickets or coupons that entitle individuals to purchase a certain amount of a given product per month.
Alternative Rationing Mechanisms • Attempts to restrict prices often result in the evolution of a black market. • A black market is a market in which illegal trading takes place at market-determined prices.
Alternative Rationing Mechanisms • The problem with rationing systems is that excess demand is created but not eliminated. • No matter how good the intentions of private organizations and governments, it is very difficult to prevent the price system from operating and to stop the willingness to pay from asserting itself.
Prices and the Allocation of Resources • Price changes resulting from shifts of demand cause profits to rise or fall. • Profits attract capital; losses lead to disinvestment. • Higher wages attract labor and encourage workers to acquire skills. • At the core of the system, supply, demand, and prices in input and output markets determine the allocation of resources and the ultimate combinations of things produced.
Price Floors • A price floor is a minimum price below which exchange is not permitted. • The most common example of a price floor is the minimum wage, which is a floor set under the price of labor. • The result of setting a price floor will be excess supply, or higher quantity supplied than quantity demanded.
Consumer Surplus • Consumer surplus is the difference between the maximum amount a person is willing to pay for a good and its current market price. • The demand curve is a representation of what people are willing to pay at a given quantity. Therefore, the difference between the price and the demand curve is the consumer surplus for a given quantity.
Consumer Surplus P S $9 Consumer Surplus for the first case of soda is $ 9 - $ 5 = $ 4, for the second case is $ 7 - $ 5 = $ 2, and For the third one is $ 5 - $ 5 = $ 0. $7 $5 D 0 Q 3 1 2
Consumer Surplus The area of this triangle is the total Consumer Surplus P S This is the generally accepted method of finding the total Consumer Surplus in a market P* D 0 Q Q*
Producer Surplus Producer surplus is the difference between the current market price and the full cost of production for the firm
Supply and Demand and Market Efficiency Producer Surplus As illustrated in Figure 4.7(a), some producers are willing to produce hamburgers for a price of $0.75 each. Since they are paid $2.50, they earn a producer surplus equal to $1.75. Other producers are willing to supply hamburgers at a price of $1.00; they receive a producer surplus equal to $1.50. Since the market price of hamburgers is $2.50, the area of the shaded triangle in Figure 4.7(b) is equal to total producer surplus.
Supply and Demand and Market Efficiency Competitive Markets Maximize the Sum of Producer and Consumer Surplus Total producer and consumer surplus is greatest where supply and demand curves intersect at equilibrium.
Supply and Demand and Market Efficiency Competitive Markets Maximize the Sum of Producer and Consumer Surplus deadweight loss The net loss of producer and consumer surplus from underproduction or overproduction.
Supply and Demand and Market Efficiency Figure 4.9(a) shows the consequences of producing 4 million hamburgers per month instead of 7 million hamburgers per month. Total producer and consumer surplus is reduced by the area of triangle ABC shaded in yellow. This is called the deadweight loss from underproduction. Figure 4.9(b) shows the consequences of producing 10 million hamburgers per month instead of 7 million hamburgers per month. As production increases from 7 million to 10 million hamburgers, the full cost of production rises above consumers’ willingness to pay, resulting in a deadweight loss equal to the area of triangle ABC.
Supply and Demand and Market Efficiency Potential Causes of Deadweight Loss From Under- and Overproduction When supply and demand interact freely, competitive markets produce what people want at least cost, that is, they are efficient. There are a number of naturally occurring sources of market failure. Monopoly power gives firms the incentive to underproduce and overprice, taxes and subsidies may distort consumer choices, external costs such as pollution and congestion may lead to over- or underproduction of some goods, and artificial price floors and price ceilings may have the same effects.