Download
1 / 2
20 likes | 215 Views
Figure2- Dose Volume Histogram Graphs of the CTV and various normal structures. Y-axes represents relative volume and x-axes displays absolute dose. NA-IMRT. A-IMRT. CNO. CPNI. NA-IMRT-H. Figure 1. Axial, Sagittal, and Coronal views of the isodoses of the five different Treatment Techniques.

E N D
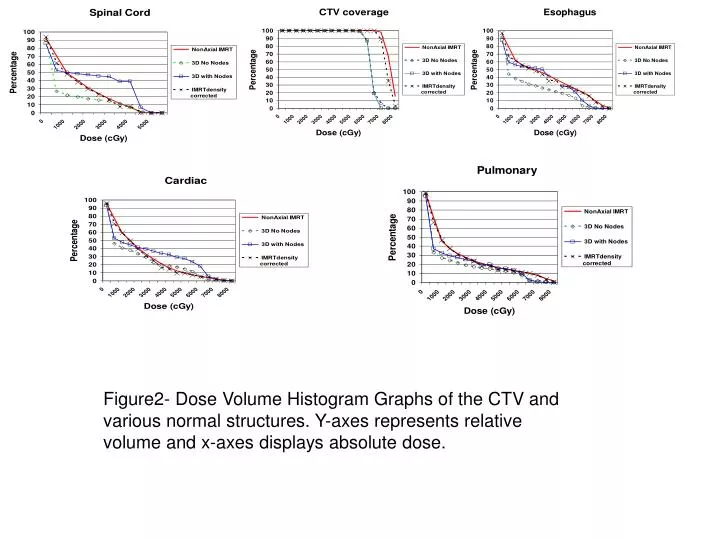
Figure2- Dose Volume Histogram Graphs of the CTV and various normal structures. Y-axes represents relative volume and x-axes displays absolute dose.
NA-IMRT A-IMRT CNO CPNI NA-IMRT-H Figure 1. Axial, Sagittal, and Coronal views of the isodoses of the five different Treatment Techniques.