Download
1 / 15
150 likes | 250 Views
Assessing Urban Forests. Top-down. Bottom-up. Assessing Urban Forests. Top-down Produces good cover estimates Can detail and map tree and other cover locations Bottom-up Provides detailed management information

E N D
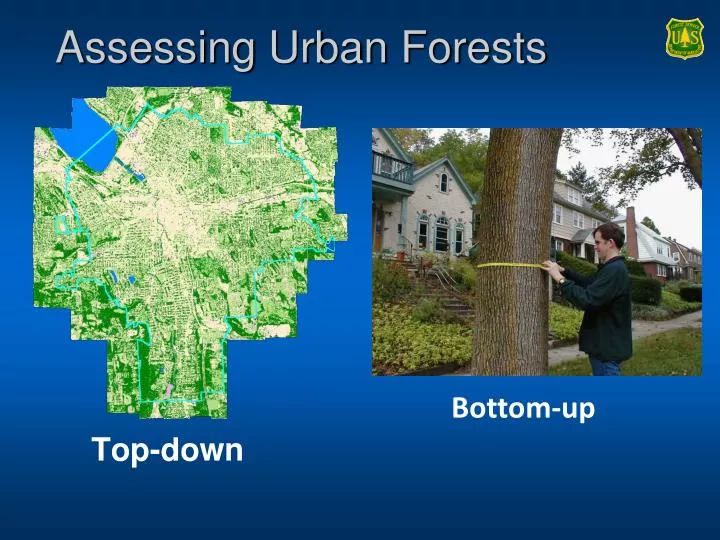
Assessing Urban Forests Top-down Bottom-up
Assessing Urban Forests • Top-down • Produces good cover estimates • Can detail and map tree and other cover locations • Bottom-up • Provides detailed management information • No. trees, spp. composition, tree sizes and health, tree locations, risk information… • Provides better means to assess and project ecosystem services and values • Air pollution removal, carbon storage…
Top-down Approaches • 30 m resolution imagery (NLCD) • High resolution imagery (UTC) • Photo-interpretation (GIS or iTree Canopy)
NLCD • Advantages • Free • Covers of lower 48 states • Data from circa 2011 • Disadvantages • Coarse resolution • Better suited for state or regional analyses • Initial analysis - underestimates tree cover • Eg. Syracuse 18% NLCD11 vs. PI 30% vs. UTC10 28%
UTC • Advantages • Accurate, high-resolution cover map • Complete census of tree canopy locations • Integrates well with GIS • Allows the data to be summarized at a broad range of scales • Locates potentially available spaces to plant trees • Disadvantages • Can be costly if the data are low quality or incomplete (LiDAR) • Requires highly trained personnel along with specialized software • Significant effort and time needed to produce quality maps • Change analyses can locate false changes due to map inaccuracies
Photo-Interpretation i-Tree Canopy • Advantages • Low cost • Accuracy can be easily increased • Can produce sub-area analyses • Disadvantages • Does not produce detailed cover map • Photo-interpreters can create errors though misclassifications • Leaf-off imagery can be difficult to interpret • i-Tree Canopy interpretation limited to Google images • Resulting data cannot be summarized at multiple, user-defined scales
N = Total points • P = no. hits; Q = no. misses (N – P) • p = % hits (P/N); q = % misses (Q/N) • %cover = P/N • SE = sqrt (p • q / N)
Standard Error • Measure of precision • 68% confidence = +/- 1 SE • 95% confidence = +/- 1.96 SE • 99% confidence = +/- 2.58 SE • E.g., at 95% CI (Margin of Error) • 30% canopy, 220 pts, ME +/- 6% • Between 24% and 36%
Demo http://www.itreetools.org/canopy/index.php
NLCD11 18% 3,000 acres
UTC 2010 28% 4,700 acres
iTree Canopy14 • 30% • 4,800 acres