Download
1 / 20
200 likes | 548 Views
8.1 The Binomial Distribution. What are the conditions for the Binomial Setting? What is the Binomial Distribution Notation? How do you compute the probability of a value of X using the Binomial Distribution? How do you find the means and standard deviation of the Binomial Distribution?.

E N D
8.1 The Binomial Distribution What are the conditions for the Binomial Setting? What is the Binomial Distribution Notation? How do you compute the probability of a value of X using the Binomial Distribution? How do you find the means and standard deviation of the Binomial Distribution?
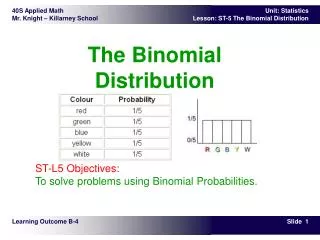
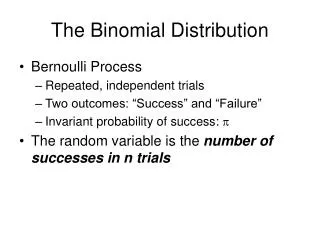
The Binomial Distribution Properties of a Binomial Experiment • It consists of a fixed number of observations called trials. • Each trial can result in one of only two mutually exclusive outcomes labeled success (S) and failure (F). • Outcomes of different trials are independent. • The probability that a trial results in S is the same for each trial. The binomial random variable X is defined as X = number of successes observed when experiment is performed The probability distribution of X is called the binomial probability distribution.
Remember from the video that Sampling Distribution of a Count is a binomial distribution when the SRS of size n is much smaller than the population!
Shorthand • Normal distributions can be described using the N(µ,σ) notation; for example, N(65.5,2.5) is a normal distribution with mean 65.5 and standard deviation 2.5. • Binomial distributions can be described using the B(n,p) notation; for example, B(5, .85) describes a binomial distribution with 5 trials and .85 probability of success for each trial.
Example • Blood type is inherited. If both parents carry genes for the O and A blood types, each child has probability 0.25 of getting two O genes and so of having blood type O. Different children inherit independently of each other. The number of O blood types among 5 children of these parents is the count X off successes in 5 independent observations. • How would you describe this with “B” notation? • X=B(5,.25)
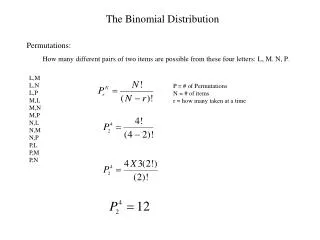
The Binomial Distribution Let n = number of independent trials in a binomial experiment p = constant probability that any particular trial results in a success. Then
12 ! = = 7 5 p ( 7 ) (. 6 ) (. 4 ) 0.2270 7 ! 5 ! Example The adult population of a large urban area is 60% black. If a jury of 12 is randomly selected from the adults in this area, what is the probability that precisely 7 jurors are black. Clearly, n=12 and p =.6, so
Example - continued The adult population of a large urban area is 60% black. If a jury of 12 is randomly selected from the adults in this area, what is the probability that less than 3 are black. Clearly, n = 12 and p= 0.6, so
Another Example On the average, 1 out of 19 people will respond favorably to a certain telephone solicitation. If 25 people are called, a) What is the probability that exactly two will respond favorably to this sales pitch?
Mean & Standard Deviation of a Binomial Random Variable The mean value and the standard deviation of a binomial random variable are, respectively,
Example A professor routinely gives quizzes containing 50 multiple choice questions with 4 possible answers, only one being correct. Occasionally he just hands the students an answer sheet without giving them the questions and asks them to guess the correct answers. Let x be a random variable defined by x = number of correct answers on such an exam Find the mean and standard deviation for x
Example - solution The random variable is clearly binomial with n = 50 and p = ¼. The mean and standard deviation of x are
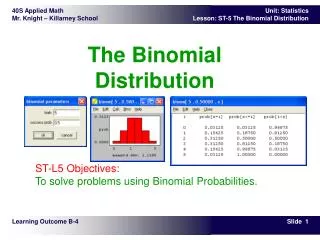
As n gets large The next three slides will show you a comparison of the binomial distribution to a normal density curve.
Conclusion about the Normal Distribution • When n is large, the distribution of X is approximately Normal. • As a rule of thumb, we will use the Normal approximation when n and p satisfy: np ≥ 10 and n(1 – p) ≥ 10
Additional cautions with the Normal approximation • The accuracy of the Normal approximation improves as the sample size n increases. • It is most accurate when p is close to ½ and least accurate when p is near 0 or 1. • It is not accurate when the distribution is skewed. • When to use the Normal approximation depends on how accurate your calculations need to be.