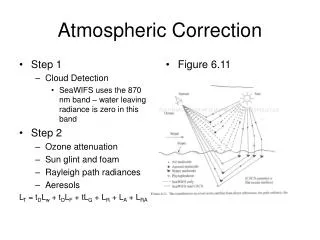
Download
1 / 22
220 likes | 331 Views
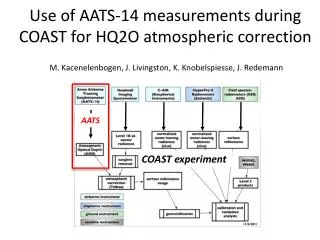
AATS. COAST experiment. Use of AATS-14 measurements during COAST for HQ2O atmospheric correction. M . Kacenelenbogen, J. Livingston, K. Knobelspiesse , J. Redemann. Oct 26 & 28 2011, Monterey Bay. Oct 26 13:30LT. Moderate AQI: PM2.5 from 12 to 35 m g/m 3. smoke. Oct 28 13:30LT.

E N D
AATS COAST experiment Use of AATS-14 measurements during COAST for HQ2O atmospheric correction M. Kacenelenbogen, J. Livingston, K. Knobelspiesse, J. Redemann
Oct 26 & 28 2011, Monterey Bay Oct 26 13:30LT Moderate AQI: PM2.5 from 12 to 35 mg/m3 smoke Oct 28 13:30LT smoke smoke? smoke
AATS-14 on Twin Otter Oct 26 AOD Altitude (km) Latitude CWV 941nm altitude Longitude AOD Oct 28 Time (UTC, LT+7hrs) ~1.8-1.9km AODzhigh CWV 941nm ~20-30m AODzlow Layer AOD AODzlow-AODzhigh altitude water Time (UTC, LT+7hrs)
AATS-14 AOD and column water vapor AOD 520nm CWV (cm) Low alt <0.63±0.04> Oct 26 Low alt <0.08±0.01> Oct 26 High alt <0.24±0.02> High alt <0.04±0.00> Low alt <0.12±0.01> Low alt <1.31±0.05> Oct 28 Oct 28 High alt <0.73±0.05> High alt <0.03±0.00>
Other inputs to atmospheric correction RH (%) Oct 26 Low alt <81±9> . relative humidity (%) . ozone concentration (DU) . wind speed (m. s-1) . aerosol models High alt <10±1> AATS AOD spectra partly informs on the aerosol model (i.e. size but not chemical composition) Oct 28 Low alt <64±7> High alt <44±7>
Five Tafkaa aerosol models Maritime (M), Coastal (C), Coastal-a (C-a), Tropospheric (T), Urban (U) Tafkaa provides fi: fractional number density of each mode i exti(l) =∫[pr2Qext,i(hi(l,RH),rm,i(RH)) xni(Ni,rm,i(RH),fi,si)dr] aerosol extinction extinction efficiency Number size distribution rm,i: mean radius of ln(r) si: standard deviation of ln(r) N: total number density of particles, assumed =1 Modal radii RH 50%->90% Maritime Coastal-a Tropospheric Urban Coastal hi: refractive index of each mode i (function of l and RH) => we compute Qext,i using a Mie code and then exti (l)
Closest Tafkaa model to AATS measurements? Tafkaal: [0.39 – 2.25mm] Tafkaa exti(lt) is normalized to AATS AOD (mean value on entire flight) at 550 nm to get Tafkaa AOD (lt) Oct 26 Note: Tafkaatropospheric is unimodal (i.e. no coarse particles and less extinction in NIR)
Closest Tafkaa model to AATS measurements? Tafkaal: [0.39 – 2.25mm] AATS l: [0.35 – 2.14mm] ⧯ AATS Error ⧯ AATS standard deviation A, B and C Oct 26
Closest Tafkaa model to AATS measurements? ⧯ AATS Error ⧯ AATS standard deviation A, B and C Oct 26
Closest Tafkaa model to AATS measurements? ⧯ AATS Error ⧯ AATS standard deviation A, B and C Oct 28
Closest Tafkaa model to AATS measurements? ⧯ AATS Error ⧯ AATS standard deviation A, B and C • X=TafkaaAOD(l), Y=AATS AOD(l), dY: uncertainty • RMSE=[ (1/N)*∑(Y-X)2 ]-1/2 • Bias=(1/N)*∑(Y-X) • Reduced chi-square cn2=(1/n)*∑[ (Y-X)2/dY2 ] • with n: d.o.f = number of number of l (i.e. 14 or 10) Oct 28 20 TafkaaAOD(l) (5 models x 4 RH) 4 AATS AOD(l) (3 segments + 1 entire flight)
Closest Tafkaa model to AATS measurements? ---- Tafkaa versus AATS AOD (l) along entire flight track Aerosol model is sensitive to Relative Humidity (%) and l range
Closest Tafkaa model to AATS measurements? ---- Tafkaa versus AATS AOD (l) along entire flight track ---- Tafkaa versus AATS AOD (l) for segments A, B, C Aerosol model does not seem sensitive to location on track
Closest Tafkaa model to AATS measurements? Statistics are averaged on different flight segments (A, B, C, entire track) and different Tafkaa model RH (50-90%) • On average (all RH and flight segments), closest Tafkaa aerosol model (i.e. smallest cn2 ) • Oct 26: Coastal-a • Oct 28: Urban • X=TafkaaAOD(l), Y=AATS AOD(l), dY: uncertainty • RMSE=[ (1/N)*∑(Y-X)2 ]-1/2 • Bias=(1/N)*∑(Y-X) • Reduced chi-square cn2=(1/n)*∑[ (Y-X)2/dY2 ] • with n: d.o.f = number of number of l (i.e. 14 or 10)
Summary • If we decide to use Tafkaa, AATS points at • Aerosol model Coastal-a on Oct 26 for RH≥70% • Aerosol model Tropospheric or Urban on Oct 28 depending on RH and wavelength range (0.39-2.25µm or 0.39-0.86µm) • but keep in mind… • No matter how small the difference between Tafkaa and AATS AOD spectra, the selected Tafkaa aerosol model might not be the absolute best representation of the aerosol because • There could be other models representing the scene more accurately (i.e. Ahmad et al., 2010, reprocessing of SeaWiFS data*) • AATS partly informs on the aerosol model through size (no info on refractive index)
Perspectives Ways that we can improve atmospheric corrections of water leaving radiances in coastal regions 1. Improve input parameters to the model By a higher information content in input to the atmospheric correction algorithm (i.e. instruments with higher spatial and spectral resolution and higher precision such as airborne AATS-14 or spaceborne PACE/ ACE/ GEO-CAPE compared to current MODIS/ HICO) for a better input of aerosol models, ozone concentration, aerosol optical depth, column water vapor, wind speed, relative humidity 2. Improve atmospheric correction algorithm By a wider range of more accurate/ physically representative aerosol models in the atmospheric correction algorithm [Ahmad et al., 2010]
Oct 26 & 28 2011, Monterey Bay Oct 26 smoke Oct 28 smoke smoke
Tafkaa aerosol models dV/dlnR Modal radii RH 50%->90% Tropospheric has 100% of mode 1 Shettle and Fenn, 1979: “longer residence of aerosols above the boundary and the expected differential loss of the larger particles. This leaves … the small particle” Maritime Coastal-a Tropospheric Urban Coastal
From Tafkaa model to calculated AOD spectra • Prepare AATS and Tafkaa for comparison (Tafkaa and AATS wavelengths, resp. lt and lA) • AATS_AOD (lA) is interpolated at Tafkaa wavelengths lt (using quadratic fit on AATS_AOD (lA), including AATS_AOD at 550nm) • Tafkaa extinction(lt) is normalized to AATS AOD (mean value on entire flight) at 550 nm to get Tafkaa_AOD (lt) 2. AATS mean error corres. to AATS mean AOD • For AATS uncertainties: • Taupart_low_unc=nansum(Unctaup(:,Mask_lower_height_AOD),2)./size(Mask_lower_height_AOD,2); • Taupart_high_unc=nansum(Unctaup(:,Mask_higher_height_AOD),2)./size(Mask_lower_height_AOD,2); • Taupart_layer_unc=sqrt(power(Taupart_low_unc,2)+power(Taupart_high_unc,2)); • AATS_closest_lambda_to_tafkaa=[2,2,3,3,4,5,6,7,8,9,10,11,11,12]; • AATS_tau_unc_Taf=AATS_tau_unc(AATS_closest_lambda_to_tafkaa);
Significance of our reduced chi-square cn2 • We do not trust TafkaaTropospheric model in NIR • Better fit between AATS and Tafkaa when wavelengths are constrained between 0.39 and 0.86 mm; better fit on Oct 26 • X=TafkaaAOD(l), Y=AATS AOD(l), dY: uncertainty • RMSE=[ (1/N)*∑(Y-X)2 ]-1/2 • Bias=(1/N)*∑(Y-X) • Reduced cn2=(1/n)*∑[ (Y-X)2/dY2 ] • with n: d.o.f = number of number of l (i.e. 14 or 10) Bevington & Robinson n: d.o.f=10 • We want smallest cn2 for biggest • Cumulative probability (i.e. area under curve) • cn2 of 0.20-0.57: significance level of 90-99% on Oct 26 • cn2 of 1.20-1.37: significance level of 20-30% on Oct 28 cn2: 1.37 0.2 c2 c2: 2 13.7 10
Significance of our reduced chi-square cn2 Bevington & Robinson