Download
1 / 10
100 likes | 311 Views
GLSEA - Great Lakes Surface Environmental Analysis (Schwab, Leshkevich and Muhr, 1999, JGLR 25(3)). GLSEA – Great Lakes Surface Environmental Analysis Based on NOAA CoastWatch AVHRR SST imagery Great Lakes synoptic window, 512x512 2.6 km pixels Linear geocorrection

E N D
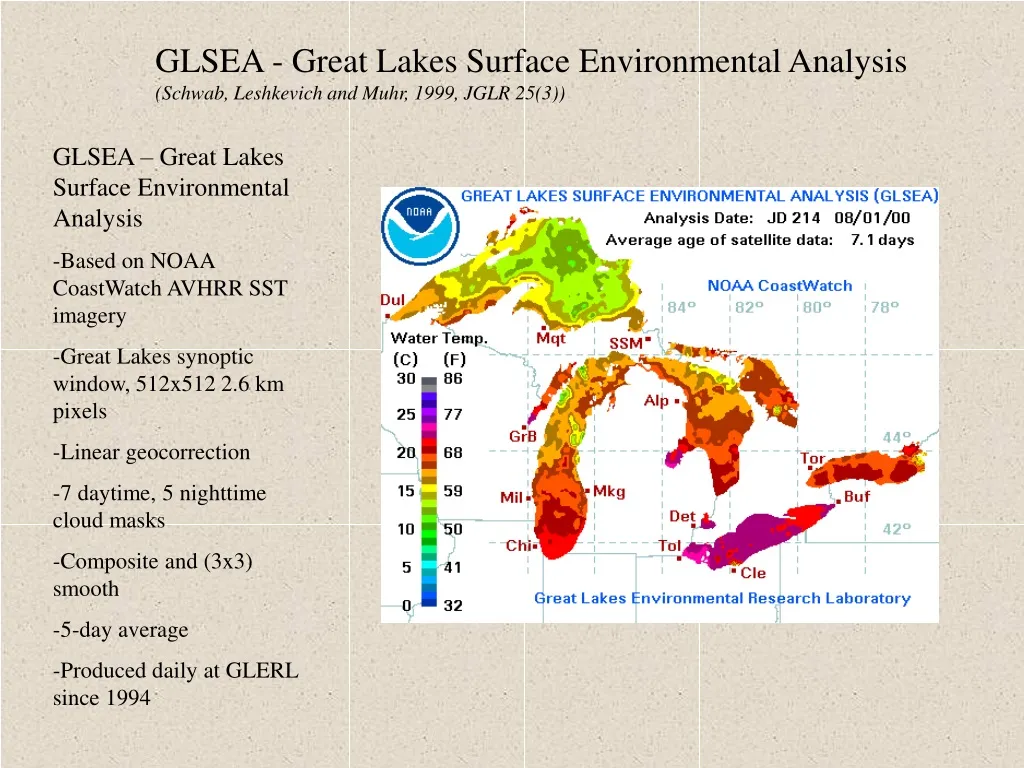
GLSEA - Great Lakes Surface Environmental Analysis (Schwab, Leshkevich and Muhr, 1999, JGLR 25(3)) • GLSEA – Great Lakes Surface Environmental Analysis • Based on NOAA CoastWatch AVHRR SST imagery • Great Lakes synoptic window, 512x512 2.6 km pixels • Linear geocorrection • 7 daytime, 5 nighttime cloud masks • Composite and (3x3) smooth • 5-day average • Produced daily at GLERL since 1994
Algorithm for GLSEA • For each day: • 1. Get GLSEA from previous day • 2. Get all SST images from last 24 hours • 3. Geocorrect SST images and apply cloud mask • 4. For each lake, overlay latest SST data if areal coverage > 5% • 5. If areal coverage for lake is > 20%, then adjust rest of lake by difference from previous day (in valid area) 6. Smooth with 9 point average 7. Average last 5 days and save GLSEA 8. Overlay latest NIC ice chart
Algorithm for GLSEA2 For each day: 1. Get GLSEA from previous day 2. Get all SST images from +/- 10 days (20 day window) 3. Geocorrect SST images and apply cloud mask 4. For each cell in GLSEA: 4.1 Get all SST values for this cell from +/- 10 days (20 day window) 4.2 If there are more than 2 values in +/- 10 day window, calculate mean and standard deviation, eliminate values more than 2 standard deviations away from mean 4.3 If there are both a prior SST value and a subsequent SST value for this cell within +/- 10 day window, then linearly interpolate in time, else if there is at least one SST value for this cell within +/- 2 days, use it 5. For any pixel not filled in Step 4: 5.1 If there are at least 6 SST values that have been filled in Step 4 in the surrounding 5x5 cells, use the average of the surrounding cells for this cell, else fill this cell with value of cell from previous day plus change in lakewide mean 6. Calculate lakewide mean for each lake and save GLSEA
GLSEA GLSEA2 0.92 1.04 0.70 0.81 1.49 0.89 1.00 0.79 1.58 1.38 1.10 1.03 1.41 1.12 1.45 1.01 Comparison with NDBC buoy daily average SWT 1995-97
GLSEA2 - New Great Lakes Surface Environmental Analysis • Based on NOAA CoastWatch AVHRR SST imagery • Great Lakes synoptic window, 512x512 2.6 km pixels (1995-2003) • 1024x1024 (2004+) • Linear geocorrection • 7 daytime, 5 nighttime cloud masks • Cell-based interpolation/extrapolation procedure • No artificial smoothing