Download
1 / 5
50 likes | 281 Views
Key Deliverables - Producing KPIs (Primary Financial). Total Controllable Expense/BOE ($/BOE) Total Controllable Expense ($MM) Fuel Controllable expense (exluding utility)/BOE ($/BOE) Production avails for sale (MBOEPD) Maintenance Capex ($MM) IDC Capex ($MM)

E N D
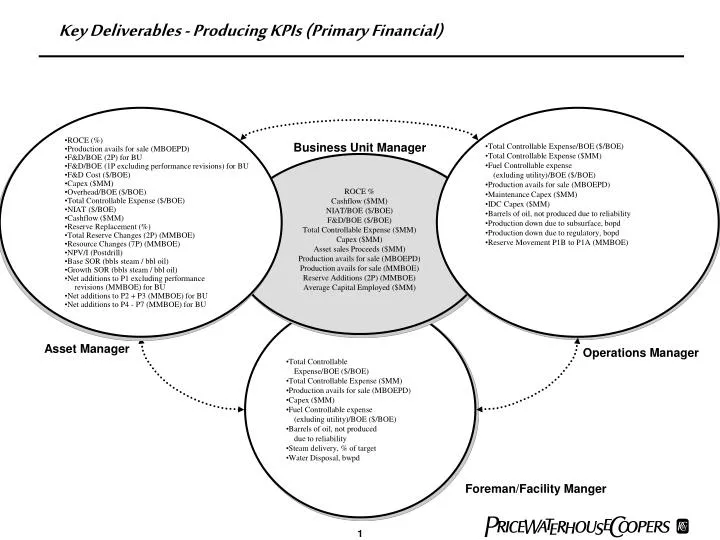
Key Deliverables - Producing KPIs (Primary Financial) • Total Controllable Expense/BOE ($/BOE) • Total Controllable Expense ($MM) • Fuel Controllable expense • (exluding utility)/BOE ($/BOE) • Production avails for sale (MBOEPD) • Maintenance Capex ($MM) • IDC Capex ($MM) • Barrels of oil, not produced due to reliability • Production down due to subsurface, bopd • Production down due to regulatory, bopd • Reserve Movement P1B to P1A (MMBOE) • ROCE (%) • Production avails for sale (MBOEPD) • F&D/BOE (2P) for BU • F&D/BOE (1P excluding performance revisions) for BU • F&D Cost ($/BOE) • Capex ($MM) • Overhead/BOE ($/BOE) • Total Controllable Expense ($/BOE) • NIAT ($/BOE) • Cashflow ($MM) • Reserve Replacement (%) • Total Reserve Changes (2P) (MMBOE) • Resource Changes (7P) (MMBOE) • NPV/I (Postdrill) • Base SOR (bbls steam / bbl oil) • Growth SOR (bbls steam / bbl oil) • Net additions to P1 excluding performance • revisions (MMBOE) for BU • Net additions to P2 + P3 (MMBOE) for BU • Net additions to P4 - P7 (MMBOE) for BU Business Unit Manager ROCE % Cashflow ($MM) NIAT/BOE ($/BOE) F&D/BOE ($/BOE) Total Controllable Expense ($MM) Capex ($MM) Asset sales Proceeds ($MM) Production avails for sale (MBOEPD) Production avails for sale (MMBOE) Reserve Additions (2P) (MMBOE) Average Capital Employed ($MM) • Total Controllable • Expense/BOE ($/BOE) • Total Controllable Expense ($MM) • Production avails for sale (MBOEPD) • Capex ($MM) • Fuel Controllable expense • (exluding utility)/BOE ($/BOE) • Barrels of oil, not produced • due to reliability • Steam delivery, % of target • Water Disposal, bwpd Asset Manager Operations Manager Foreman/Facility Manger
Compressor Utilization Rate • UOP Rate • Treating Cost/BOE ($/BOE) • Steam Generation Cost/BOE ($/BOE) • Water Handling Cost/BOE ($/BOE) Key Deliverables - Producing KPIs (Secondary Financial) Business Unit Manager • Area level Overhead ($/BOE) • Lifting Cost Efficiency ($/BOE) • Fuel Controllable expense (exluding utility)/BOE ($/BOE) • Capex Efficiency (UOP Rate) • F&D Cost/BOE 5 years average • Net additions to P1 excluding performance revisions • Reserve Movement P1B to P1A (MMBOE) • Internal Overhead ($/BOE) • Reserve Replacement Ratio (%) • P-movement • Capex (Exploitation + Drilling) ($MM • Capex IDC ($MM) • Capex (Maintenance + Facility) ($MM • Fuel Controllable expense • (exluding utility)/BOE ($/BOE) • Total Controllable Expense/BOE ($/BOE) • Cashflow/BOE ($/BOE) • Total Overhead/BOE ($/BOE) • Non Controllable Expense/BOE ($/BOE) • NIAT ($MM) • R/P • Resources: P3-P7 movement to P1/P2 (MMBOE) • SOR (bbls steam / bbl oil) • Barrels of oil, not produced due to reliability • Audit Findings (number) • Internal Overhead ($/BOE) • External Overhead ($/BOE) • Net additions to P1 excluding performance revisions (MMBOE) • Net additions to P2 & P3 (MMBOE) • Net additions to P4 - P7 (MMBOE) • Capex Efficiency (UOP Rate) • Capex Efficiency (UOP Rate) • Maintenance Capex/BOE ($/BOE) • IDC Workover Capex (MM$) • Internal Overhead ($/BOE) • Total Controllable Expense ($MM) • Reserve Movement from P1B to P1A • NPV/I (Post Drill) • UOP Rate • SOR (bbls steam / bbl oil) Asset Manager Operations Manager Foreman/Facility Manger
Key Deliverables - Producing KPIs (S,H&E) • OSHA Recordables (Total, Contractor, and Employee) • ORIR (Total, Contractor, and Employee) • Lost Time Accidents (Total, Contractor, and Employee) • LTIR (Total, Contractor, and Employee) • Vehicle Accidents • Vehicle Accidents Rate per MM Miles (Employees) • Number of Spills • BBls Spilled • MMS INC's (Incidents of non-compliance) • "BASES" Observations • Star days (days with no environmental incidents) • First Aids • Red Books • # NOVs and INCs • Safe Days • Star Cards Business Unit Manager • OSHA Recordables (Total, Contractor, and Employee) • ORIR (Total, Contractor, and Employee) • Lost Time Accidents (Total, Contractor, and Employee) • LTIR (Total, Contractor, and Employee) • Chargeable Vehicle Accidents • Vehicle Accidents Rate per MM Miles (Employees) • Number of Spills • BBls Spilled • MMS INC's (Incidents of non-compliance) • Star days (days with no environmental incidents) • First Aids • Audit Findings (number) • Red Books • OSHA Recordables (Total) • ORIR (Total) • Lost Time Accidents (Total) • LTIR (Total) • Chargeable Vehicle Accidents • Number of Spills • BBls Spilled • OSHA Recordables (Total, Contractor, and Employee) • ORIR (Total, Contractor, and Employee) • Lost Time Accidents (Total, Contractor, and Employee) • LTIR (Total, Contractor, and Employee) • Vehicle Accidents • Vehicle Accidents Rate per MM Miles (Employees) • Number of Spills • BBls SpilledMMS INC's (Incidents of non-compliance) • "BASES" Observations • Star days (days with no environmental incidents) • First Aids • Red Books • # NOVs and INCs • Safe Days • Star Cards Asset Manager Operations Manager Foreman/Facility Manger
Key Deliverables - C&D KPIs Executive VP & Mgmt Team • Spend rate (CD CAPEX vs. Budget) • Reserve Additions (CD plan vs. actual) • UT expenses vs. budget • % UT cost recovery • LTIs & driving Incidents • % of total UT charges to CD primary projects • % of total UT charges to PBU primary objectives • (12/3 for 2001) • % of total UT charges to CD pilots and studies • Delivery performance of MAJOR tactical • service requests (based on cost, schedule, • quality performance vs. expectations) • Delivery of key strategic project milestones • Potential business prize vs. UT effort • Technology leverage ratio • Lost Time Incident Rates • Drilling Cost Variance • Non-productive time/Total time • Project drilling cost/Total feet drilled • Project drilling days/Well • Reduction in reportable spills • Vehicle accidents per hours used • Reduction in number of Notice Of Violations • & MMS INCs • Drilling schedule variance • CD drilling overhead/Total BOE adds incl. rev. • Spend rate (CAPEX vs. Budget) • Reserve Additions (P1 & P2) • Schedule (milestone progress) • Lost Time Incident Rates • Drilling Cost Variance • Development Costs/BOE adds • Total NPV growth with options • ROCE % • Cash flow ($MM) • Portfolio risk balance • Total CD overhead/Total Expenses Upstream Technology Global Drilling • C&D: Spend rate (CAPEX vs. Budget) • C&D: Reserve Additions (P1 & P2) • C&D: Schedule (milestone progress) • C&D: Total Project Costs/Total BOE adds • C&D: F&D costs/Total BOE adds • C&D: NPV growth with options • C&D: Safety (LTI) & environmental record • C: Reserve adds and movement P5 through P7 • D: Growth Rate of Reserve adds (P1-P2) • C&D: Full-life ROI • C&D: Gas liquid ratio of BOE adds • C: Conversion from P5-P7 to P1-P4 (AR) • D: Conversion from P3-P4 to P1-P2 Project Teams
Key Deliverables - Exploration KPIs Executive VP • Change in Value (ENV/I) • (with Options Value) • Number of Prospects Matured • Acreage identified • and recommended • Commercial resource Additions • Vs Plan (3 yr rolling average) (MMBOE) • Resource Capture Cost ($/BOE) • Number of Prospects Matured • Acreage added • Change in Value (ENV/I) • (with Options Value) • Predictability +/- 15% • Exploration Expense Vs Budget Asset Manager* Business Unit Manager Team*