Download
1 / 65
650 likes | 761 Views
Observations of Vortex Dynamics on Jupiter. and What They Imply About Its Climate. Philip Marcus – University of California at Berkeley. 1998. 2007. Climate Change on Jupiter?. Starting in 2001 we began publishing claims that Jupiter would have a significant climate change

E N D
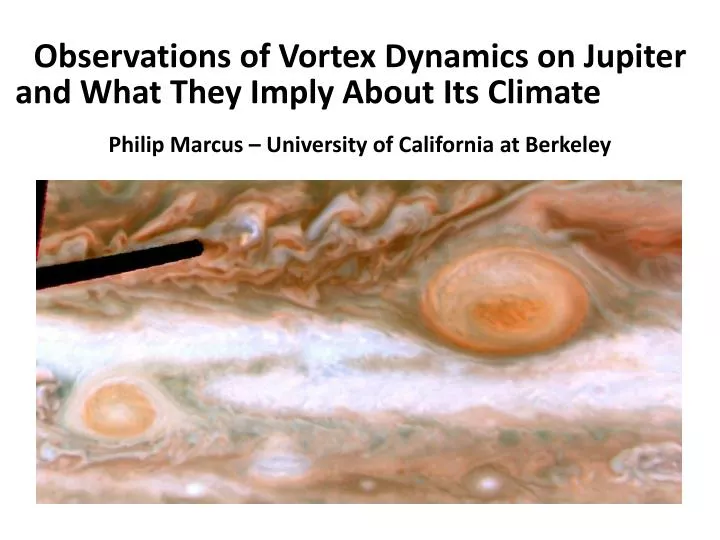
Observations of Vortex Dynamics on Jupiter and What They Imply About Its Climate Philip Marcus – University of California at Berkeley
Climate Change on Jupiter? • Starting in 2001 we began publishing claims that Jupiter would have a significant climate change • Predicted first observable consequences would be seen in 2006 • Temperature changes of 10o or more
A Change From What? • Our general picture of Jupiter is from the era of the Voyager fly-bys in the late 1970’s • In agreement with ground-based telescope photographs • Hints of change from Galileo and Hubble observations
Jet Streams, Vortices & Turbulence • 12 Eastward-going and 12 Westward-going jet streams ~50-100m/sec • Long-lived vortices • Red Spot, 3 White Ovals • 90% are Anti-Cyclones • Turbulence is ~2 m/sec
Remote Sensing • Are Long-Lived Clouds Vortices? • If so, are the cyclones or anticyclones? • Can there be long-lived vortices that are not associated with clouds?
Rows of Anti-cyclones • Except for the Great Red Spot, the anti-cyclones do not occur as single vortices. • They occur in rows (at a constant latitude). • Each latitude corresponds to a peak of a westward jet (or just to its poleward side).
Quasi-geostrophic Stream function Potential vorticity q ≡ ∇2 - /Lr2 + β y + bottom(y)/Lr2 Vorticity = ∇2 Rossby deformation radius Lr ≡ (N/f) H (2000 km) Vertical pressure scale height H (30 km) D q /D t =0
y cyclone U(y) anti-cyclone
A C C A A Cyclone below critical value
C A A
In quasi-geostrophic simulations cyclones and anti-cyclones are treated the same
The Case for Cyclones • Dynamically necessary to prevent anti-cyclones from merging • Dynamically necessary to change drift directions of the anti-cyclones • Allowed by the equations of motion (3D, 2D-shallow-water, 2D-quasi-geostrophic)
Streamlines are not particle pathlines • Clouds are NH3 ice crystals • Created with cooling, destroyed with warming • Due to 3D secondary flow: • Anti-cyclonic regions have upwelling • Cyclonic regions have down-welling • In a sub-adiabatic atmosphere upwelling cools the flow
“Anti-cyclone” refers to the potential vorticity Vortex is a compact of potential vorticity; total circulation (of vorticity) is zero. An anti-cyclone (like the Red Spot) is surrounded by a cyclonic ring of vorticity Anti-cyclonic Up-welling Ice forms Cyclonic Down-welling Ice melts
Need for HeatTransport • Voyager (1979) used several instruments to look at multiple wavelengths to measure temperature at the cloud tops. • Surprise! The temp. was isothermal in longitude § 4K. least half of the heat deposited from the Sun is captured and absorbed in the cloud layer
Thermal Emission Absorbed Solar FLUX (W/m2) Uniform Internal Non-uniform Internal LATITUDE
Need for HeatTransport • Modeling the top of the convective zone with a perfect conductor – still leaves a pole-equator heat differential of 30K • Including the mixing of heat with the meriodional velocity of the vortex street did not significantly decrease the pole-equator heat differential
Chaotic Mixing of Heat If chaotic rows of vortices are necessary for heat transfer, then the mergers of the 3 White Ovals in 2000 would have lead to a barrier to heat transport at 340S PSM Nature 2004
No Thermometers on Jupiter • No space or ground-based telescope since Voyager can measure cloud top temperature • Limited observations coupled with models would work if there were no clouds. • Need to infer temperature changes • But first, let’s revisit the measurements of velocities
New Red Oval The White Oval that formed in 2000 turned red in December 2005 Is this a sign of a change in temperature?
Manual Cloud Tracking GRS • 10 hours tracks ~103 velocity vector • too few vectors • Uncertainty ~10 m/s
Automatic Methods used in Lab • Cannot track feature of GRS for more than 40 minutes • ~105 velocity vectors; Uncertainty ~32 m/s
Advection Corrected CIV GRS • Tracks for 10 hours,~3x10⁶ velocity vectors • Uncertainty ~5 m/s
Solid line is 2006 (HST) Broken line is 2000 (Cassini)