Download
1 / 18
180 likes | 353 Views
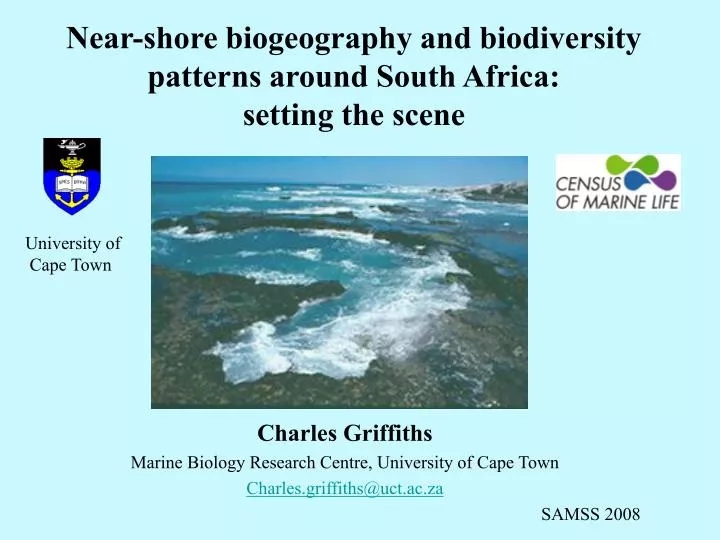
Near-shore biogeography and biodiversity patterns around South Africa: setting the scene. University of Cape Town. Charles Griffiths Marine Biology Research Centre, University of Cape Town Charles.griffiths@uct.ac.za SAMSS 2008. Presentation format:

E N D
Near-shore biogeography and biodiversity patterns around South Africa: setting the scene University of Cape Town Charles Griffiths Marine Biology Research Centre, University of Cape Town Charles.griffiths@uct.ac.za SAMSS 2008
Presentation format: • Marine biodiversity of South Africa. • Geographic gradients. • Biogeographic provinces. • Long-shore patterns within taxa. • Reliability of these data? • Potential for new discoveries! • Take home messages.
Overall marine biodiversity in South African (Gibbons et al. 1999 - reprints available from speaker) Phylum No No % RSA spp RSA endemics RSA Endemism Algae 850 ca 340 ca 40 Placozoa 0 0 0 Porifera 289 10 3 Cnidaria 842 238 28 Ctenophora 11 0 0 Nematoda 338 30 9 Platyhelminthes 28 17 61 Rotifera 0 0 0 Tardigrada 0 0 0 Gastrotricha 0 0 0 Kinorhyncha 1 0 0 Gnathostomula 0 0 0 Annelida 766 161 21 Mollusca 3062 1592 52 Crustacea 2333 719 31 Chelicerata 115 57 50 Brachiopoda 31 15 48 Bryozoa 280 99 35 Echinodermata 410 187 46 Echiura 21 1 5 Priapula 1 0 0 Entoprocta 6 0 0 Loricifera 0 0 0 Sipuncula 47 0 0 Pogonophora 1 1 100 Phorona 0 0 0 Chaetognatha 28 0 0 Nemertea 17 5 29 Hemichordata 11 2 18 Chordata 2492 362 15 Totals 11980 3836 32.02
Gradients in productivity and biomass: South Coast East Coast West Coast B. 60 50 40 Productivity (µg chl-a.cm-2.mo-1) 30 20 10 0 0 10 20 30 40 Distance around coast (km x 100) Adapted by G Branch from Bustamante et al. 1996 J. Biogeog. 23:339-351
West Coast South Coast East Coast 600 D. Exposed shores 500 Sheltered shores 400 Algal biomass (g AFDM.m-2) 300 200 100 0 0 10 20 30 40 Distance around coast (km x 100)
South Coast East Coast West Coast 200 F. Exposed shores Sheltered shores 150 Grazer biomass (g AFDM.m-2) 100 50 0 30 40 0 10 20 Distance around coast (km x 100) (Branch 2001)
South Coast East Coast West Coast 2500 E. Exposed shores 2000 Sheltered shores 1500 Filter-feeder biomass (g AFDM.m-2) 1000 500 0 0 10 20 30 40 Distance around coast (km x 100)
Identification of provinces and plotting of biodiversity patterns Method: Coast divided into (50 or) 100 km zones and species recorded in each unit compared
Recognized marine provinces around South Africa, ( based on biodiversity patterns as originally analysed by Emanuel et al. 1992) Source: S.A. State of the Environment Report 2004
Long-shore biodiversity patterns within faunal groups - 1: Fish: species richness increases from west to east: Clinidae and Sparidae, two largely endemic families Namibia Cape Town Port Elizabeth Durban Source: Turpie, Beckley & Katua 2000. Biol. Cons. 92:59-72
2: Invertebrates: Patterns differ radically between taxa (making use of ‘proxies’ dangerous!): Some groups become more species rich to the east:
Others peak in Western Cape, declining to both E. and W. All data: Awad, Griffiths & Turpie 2002 Diversity and Distributions 8:129-145
For all invertebrates summed, species richness peaks along south coast, declining on the North East Coast Species per 100 km stretch 1= Orange R 8= Cape Town 16= Port Elizabeth 24= Durban Range-restricted species (range <300km) concentrated at ecotones!
But how valid are these data ? Absolute species richness is certainly underestimated! If compare species counts between Africa and Europe better known groups comparable, but poorly known ones clearly under-represented in Africa! Estimate 6 000 more species need to be described to raise level of knowledge to that of Europe, itself far from complete! (Medd 2006)!
2. Are geographic patterns an artifact of unequal sampling effort? To some extent, yes, as the KwaZulu-Natal coast has most species per sample, but the species/area curve is not close to a plateau! (after Medd 2006) South coast KZ-Natal West coast Namibia
Upside of this under-exploration: enormous potential for new discoveries! Recent examples include: Preactiidae - endemic anemone family New rock-lobster from Walter’s Shoal 2006 Lemindidae - endemic nudibranch family
Single 2005 photograph of crinoids from False Bay revealed both: - a new Hippolyte shrimp - a new species of Myzostomida Hippolyte n.sp. Hypomyzostoma n. sp.
Take home messages 1. South Africa has a diverse coastal environment of four main provinces and a rich, highly endemic fauna. 2. Spatial patterns of biodiversity differ between groups. 3. Perhaps a third of macro-faunal species remain un-described! 4. There is huge potential for taxonomic discovery! Many thanks to the Sloan Foundation and South African National Research Foundation for financial support. Also George Branch for use of data and graphics.