Download
1 / 1
10 likes | 139 Views
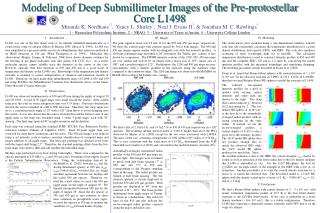
Modeling of Deep Submillimeter Images of the Pre-protostellar. Core L1498. Miranda K. Nordhaus 1,2 , Yancy L. Shirley 2 , Neal J. Evans II 3 , & Jonathan M. C. Rawlings 4. 1 – Rensselaer Polytechnic Institute, 2 – NRAO, 3 – University of Texas at Austin, 4 – University College London.

E N D
Modeling of Deep Submillimeter Images of the Pre-protostellar Core L1498 Miranda K.Nordhaus1,2, Yancy L.Shirley2, Neal J. EvansII3, & Jonathan M. C.Rawlings4 1 – Rensselaer Polytechnic Institute, 2 – NRAO, 3 – University of Texas at Austin, 4 – University College London • Introduction • L1498 was one of the first dense cores to be initially identified kinematically as a cloud on the verge of collapse (Myers & Benson 1983, Zhou et al. 1994). L1498 was later identified as a pre-protostellar core by its submillimeter dust emission and lack of an IRAS detection at 100 μm (Ward Thompson et al. 1994). Molecular line observations (Kuiper, Langer, & Velusamy 1996) have shown dramatic evidence for the freezing of gas phase molecules onto dust grains (CS, CCS, etc.). As a result, molecular species cannot reliably trace the densities in the center of the core. However, optically thin dust emission at 850 and 450 μm is a good tracer of temperature and density in the L1498 core. Knowledge of the temperature and density structure is essential to correct interpretation of chemical and kinematic models of L1498. Therefore, we have made deep submillimeter maps of L1498 at 850 and 450 μm using SCUBA, the Submillimeter Common User Bolometer Array, on the James Clerk Maxwell 15 meter telescope. • Observations • L1498 was observed simultaneously at 850 and 450 μm during the nights of August 29 and 30, 1998. A total of 50 jiggle maps were made toward the source. After careful reduction, the total on source integration time was 3.55 hours. Previous observations showed the source extended in a SE to NW direction. Therefore, the chop angle was set to a constant position angle of 20° with a 120” chop throw to avoid chopping onto the source. It was also shown that the source extended beyond the field of view of one jiggle map, so the map was extended using 3 offset 5-point maps, each with 30” spacing. The final map spans ±140” in right ascension and declination. • Each map was reduced using the standard SURF, SCUBA User Reduction Facility, reduction routines (Jenness & Lightfoot 1997). Each 64-point jiggle map was corrected for chop throw, extinction, and sky noise. The 450 μm images were reduced using a set intensity scale to ensure consistent identification of corrupted maps and proper addition of all jiggle maps. The telescope pointing was checked every hour, with the largest shift being 2.5”. Therefore, the standard pointing offsets from the five-point maps were used to shift and add together the individual maps. • Skydips were performed every hour during both nights. These were compared to the opacity measured at 225 GHz (tcso) and 350 μm every 10 minutes from tippers located at the Caltech Submillimeter Observatory. Using the relationship derived by • Images • The peak signal-to-noise was 18 and 13 for the 850 and 450 μm maps, respectively. We show the contour maps with contours spaced by 3σ for both images. The 850 and 450 μm images appear similar with an elongated core with flat intensity profiles. A 1200 μm continuum map smoothed to 20” resolution (M. Tafalla, priv. comm.) is also shown for comparison. The FWHM intensity contour of the 1200, 850, 450 μm maps are very similar and well fit by an ellipse with a major axis of 197”, minor axis of 108”, and a position angle of 122°. Furthermore, the 1200 and 850 μm maps are non-axisymmetric with a sharper gradient in the intensity along the northeast edge compared to the southwest ridge. The 1200 μm image was observed with MAMBO on IRAM-30m (courtesy M. Tafalla, priv. comm.). • Modeling • The observations were modeled using a one-dimensional radiative transfer code that self-consistently calculates the temperature distribution for a given density distribution, dust opacity (OH5), and ISRF. The code also simulates scattering of short wavelength light (uv to near-IR). The calculated temperature distribution is used to construct intensity profiles at 850 and 450 mm and the complete SED (170 mm to 1.2 mm) by convolving the model intensity profiles with the measured beamshape and simulating chopping. The modeling procedure is fully described in Evans et al. (2001). • Evans et al. found that Bonnor-Ebert spheres with central densities of 1 x 10⁵ to 106 cm-3 fit the observed structure in 3 PPCs (L1512, L1544, & L1689B); therefore we used Bonnor-Ebert (BE) sphere to model the structure of L1498. The reduced chi-squared intensity profiles for a grid of models with varying central densities and outer radii are shown to the right. The deep blue contour indicate c2r between [0,2] increasing by 2. The low density BE-sphere of 1x104 cm-3 is the best fit to the azimuthally averaged radial profiles with no strong constraint on the outer radius. If instead, we use the sector-averaged profiles, a central density of 3x10⁴ is also a good fit to the intensity profiles. The 1x10⁴ model BE sphere does not produce enough flux to match the observed SED while the 3x10⁴ model BE sphere produces too much flux. Since We find a flux of 2.30±0.4 Jy and 14.7±2.5 Jy at 850 & 450 mm respectively in a 120” aperture. The resulting submm spectral index is 2.9±0.6, higher than all of the PPCs observed by Shirley et al. (2000) except for the two cores associated with L1689A. The mass of the core, assuming a temperature of 10 K within a 60” radius, is 0.74 Msun. This is very consistent with the virial mass of 0.67 Msun determined from the N2H+ linewidth (see Caselli et al. 2002) and corrected for the modeled density structure (IV). Azimuthally-averaged, normalized radial profiles of the 850 and 450 μm maps are shown right. The images were re-binned to pixels with half beam spacing (7” at 850 μm and 3.5” at 450 μm) corresponding to the Nyquist sampling limit in the map. The radial profiles are binned at half beam spacing. The flat intensity plateau is clearly displayed in both the 850 and 450 μm profiles. Both profiles are displayed to 98” from the centroid (+11”, -16”). The beam profile determined from jiggle maps of Uranus is shown as a dashed line. The solid red lines in the 850 μm plot indicate the sector-averaged radial profiles centered along the major and minor axes. the incident radiation is due to the ISRF, the overall strength, sisrf, maybe be varied as well as extinction at the outer radius due to the low density medium that L1498 is embedded in (Av). For the 1x10⁴ BE-sphere, the best fit c2r(SED) are for high values of the strength of the ISRF with a few Av of extinction. Another possibility is to scale the overall density structure by a factor, k, to match the observed flux. The best-fitted model is a 1x10⁴ BE sphere with the density scaled up by a factor of 2, Ro ~ 35000 AU, sisrf = 1.0, and Av > 2 mag. Archibald et al. (2002) between τcso and the skydip determined opacity at 850 μm (τ850), τ850=(3.99±0.02)(τcso–0.004±0.001),we found excellent agreement between our skydips and the scaled 850 μm opacity. Therefore, we used the scaled values to correct the 850 μm jiggle maps on the night of August 30. We linearly interpolated between 850 μm for the night of August 29. Since the sky opacity at 350 and 450 μm is very sensitive to short term variations in precipitable water vapor, we used the opacity at 350 μm to monitor the variability of τ450 between hourly skydips. V. Conclusions We find a Bonnor-Ebert sphere with central density of 1 – 3 x 104 cm-3 with nearly isothermal temperature profile of 10.5 K is the best fitted density structure to the SCUBA observations. If the core is embedded in a lower density medium (~ few 102 cm-3), this is a stable configuration. Therefore, L1498 may represent a chemically mature, currently stable PPC that is on the verge of collapse.