Download

1 / 11
110 likes | 232 Views
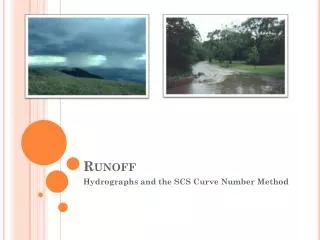
Trends in Iowa Runoff . Kristie J. Franz Department of Geological & Atmospheric Sciences Iowa State University kfranz@iastate.edu. Runoff – water that runs over land. Influenced by: Soil texture and structure Land surface characteristics (slope, vegetation, bare soil, land use)

E N D
Trends in Iowa Runoff Kristie J. Franz Department of Geological & Atmospheric Sciences Iowa State University kfranz@iastate.edu
Runoff – water that runs over land • Influenced by: • Soil texture and structure • Land surface characteristics (slope, vegetation, bare soil, land use) • Water input rate http://www.savannahenvironmental.com/stormwater.htm
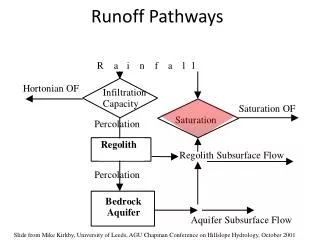
Runoff = Water input - Infiltration Infiltration – entry of water into soil • Influenced by: • Physical characteristics of the surface and soil (e.g. soil texture and structure, land cover, land use) • Soil moisture
Number and size of holes tell us how much water soil can hold
Connections, size and content of open spaces tell us how fast water can move into and through soil.
Amount of runoff also depends on water application rate Runoff = Water input - Infiltration
Trends in Iowa Runoff (Streamflow) Number of high flow days per year • Of 10 watersheds studied: • 8 had increasing average daily streamflow (50% increase) • 9 had increasing number of high flow days • 3 had increasing number of extreme flow days 1950 2000 1950 2000 (10-year running averages) Conrad, 2010
Modeling Watersheds 10 year running average mean daily discharge “tune” the model to different time periods • Model results from the 3 calibrations were plotted with the observed • We would expect each simulation to match best with the period it was calibrated to • Increasing streamflow in response to climate for all scenarios • But none follow observed perfectly • We are not considering land use change over time 1950 2000 Conrad, 2010
Impacts of Land Use on Infiltration Source: Bharati et. al., 2002 Source: Bharati et. al., 2002
Changes in Iowa Farmland • More row crops • Row crops have higher runoff rates
Summary • We get more runoff when: • soils are wetter • we get more intense precipitation • We have wetter soils when: • we get more precipitation on average (snow or rain) • we get more frequent precipitation (no time to dry or drain) • Climate does explain increasing runoff trends in Iowa • ...but need to also consider land use change