Download
1 / 14
150 likes | 374 Views
KEY CONCEPT Organisms can be classified based on physical similarities. Linnaeus developed the scientific naming system still used today. Taxonomy is the science of naming and classifying organisms. . White oak: Quercus alba. A taxon is a group of organisms in a classification system.

E N D
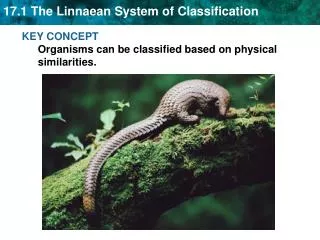
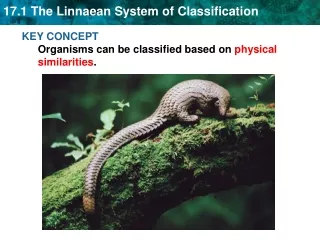
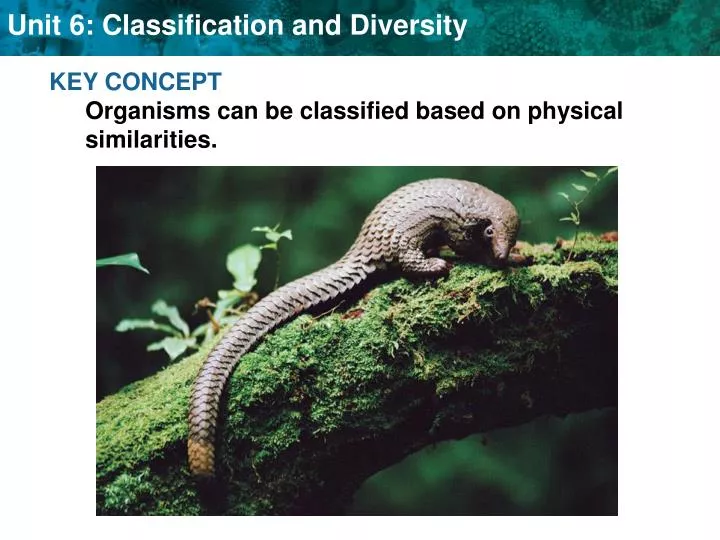
KEY CONCEPT Organisms can be classified based on physical similarities.
Linnaeus developed the scientific naming system still used today. • Taxonomy is the science of naming and classifying organisms. White oak:Quercus alba • A taxon is a group of organisms in a classification system.
The Linnaean classification system has limitations. • Linnaeus taxonomy doesn’t account for molecular evidence. • The technology didn’t exist during Linneaus’ time. • Linnaean system based only on physical similarities.
Physical similarities are not always the result of close relationships. • Genetic similarities more accurately show evolutionary relationships.
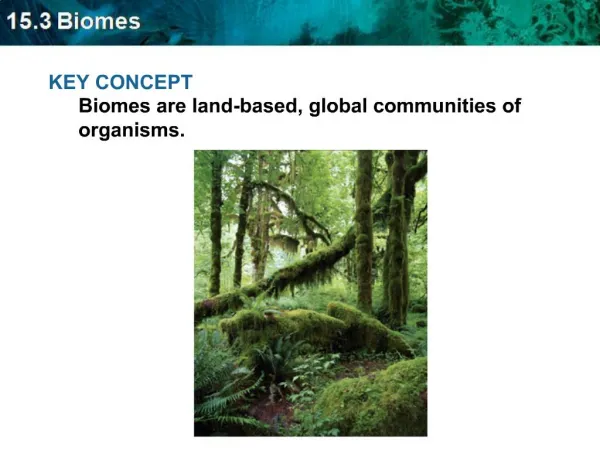
KEY CONCEPT Modern classification is based on evolutionary relationships.
Cladistics is classification based on common ancestry. • Phylogeny is the evolutionary history for a group of species. • evidence from living species, fossil record, and molecular data • shown with branching tree diagrams
classification based on common ancestry • species placed in order that they descended from common ancestor • Cladistics is a common method to make evolutionary trees.
A cladogram is an evolutionary tree made using cladistics. • A clade is a group of species that shares a common ancestor. • Each species in a clade shares some traits with the ancestor. • Each species in a clade has traits that have changed.
1 Tetrapoda clade 2 Amniota clade 3 Reptilia clade 4 Diapsida clade 5 Archosauria clade FEATHERS & TOOTHLESS BEAKS. SKULL OPENINGS IN FRONT OF THE EYE & IN THE JAW OPENING IN THE SIDE OF THE SKULL SKULL OPENINGS BEHIND THE EYE EMBRYO PROTECTED BY AMNIOTIC FLUID FOUR LIMBS WITH DIGITS DERIVED CHARACTER • Derived characters are traits shared in different degrees by clade members. • basis of arranging species in cladogram • more closely related species share more derived characters • represented on cladogram as hash marks
CLADE 1 Tetrapoda clade 2 Amniota clade 3 Reptilia clade 4 Diapsida clade 5 Archosauria clade NODE FOUR LIMBS WITH DIGITS DERIVED CHARACTER • Nodes represent the most recent common ancestor of a clade. • Clades can be identified by snipping a branch under a node. FEATHERS AND TOOTHLESS BEAKS. SKULL OPENINGS IN FRONT OF THE EYE AND IN THE JAW OPENING IN THE SIDE OF THE SKULL SKULL OPENINGS BEHIND THE EYE EMBRYO PROTECTED BY AMNIOTIC FLUID
Molecular evidence reveals species’ relatedness. • Molecular data may confirm classification based on physical similarities. • Molecular data may lead scientists to propose a new classification. • DNA is usually given the last word by scientists.
KEY CONCEPT Molecular clocks provide clues to evolutionary history.
Mutations add up at a fairly constant rate in the DNA of species that evolved from a common ancestor. Ten million years later— one mutation in each lineage Another ten million years later— one more mutation in each lineage Molecular clocks use mutations to estimate evolutionary time. • Mutations add up at a constant rate in related species. • This rate is the ticking of the molecular clock. • As more time passes, there will be more mutations. The DNA sequences from two descendant species show mutations that have accumulated (black). The mutation rate of this sequence equals one mutation per ten million years. DNA sequence from a hypothetical ancestor
Scientists estimate mutation rates by linking molecular data and real time. • an event known to separate species • the first appearance of a species in fossil record