Download
1 / 30
310 likes | 477 Views
Mass Transportation Blue Team: Robert Wyman, Jessica Bryan, Courtney Flowers, Zach Tigert, Emily Casey, Moriah Balingit. The History of Mass Transportation. Pre-20 th Century. 1662 The first "bus" 1825 First locomotive 1863 First subway opens

E N D
Mass TransportationBlue Team: Robert Wyman, Jessica Bryan, Courtney Flowers, Zach Tigert, Emily Casey, Moriah Balingit
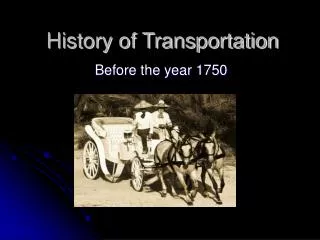
Pre-20th Century • 1662 The first "bus" • 1825 First locomotive • 1863 First subway opens • 1869 First transcontinental railroad completed • 1886 First citywide electric trolley system
20th Century • 1900 95% of people travel by train. 90% of freight was shipped by train. • Large-scale mass transit starts with industrialization in early 20th Century. • Use of mass transit rose from 6 billion annual passengers in 1900 to over 17 billion in 1927. • Mass Transit in the States reached its peak in 1946 at 23 billion riders • 1954 54% of freight shipped by train in the United States • 1961 Provided first federal assistance for mass transit. • 1964 90% of people in the U.S. travel by private automobile. • 1972 Bay Area Rapid Transit (BART) system dedicated as the first "high tech" system. • 1974 National Mass Transportation Assistance Act passed • 1990 Rail trolley systems had achieved substantial resurgence in the U.S.
Histogram! • Source:“Making Transit Work: Insight from Western Europe, Canada, and the U.S.” Transportation Research Board, Special Report 257, 2001
U.S. vs. Europe (ding ding) • 10 to 20% urban trips transit in Europe, compared to 2% in US • 38% of work trips made on transit in Europe compared to 9.0% in the US. • 18.4% workers who walk or bicycle compared to 4.9% in the US • Boston 55 bicycles per hour, Paris 74, Amsterdam 242.
Modes of Travel, by Country • Source:“Making Transit Work: Insight from Western Europe, Canada, and the U.S.” Transportation Research Board, Special Report 257, 2001
Data Analysis • Analyzing the data in this table, we find that there are 8.16 billion mass transit riders per year in the U.S. • U.S. population= 295,734,134 (July 2005) • Yearly riders/population amounts to approximately 28 rides per U.S. citizen per year
U.S. Statistics • Buses 60% mass transit in the US • Metropolitan Boston, Chicago, San Francisco, Washington D.C., Philadelphia, New York 65% of transit use, only 20% of urban population
U.S. and Germany • According to the German Department of Transportation (Bundesministerium fuer Verkehr, Bau, und Stadtentwicklung), 27 million Germans use mass transportation everyday • This computes out to 9.86 Billion riders per year • Germany's population= 82,431,390 (July 2005) • Yearly riders/population is approximately 120 rides per German citizen/yr. • Conclusion: Germans use public transportation about 4 times as often as Americans
Funding • Italy, France, Germany, Sweden, Netherlands and Belgium, subsidies for public transportation are high, fares range between 15 to 40 percent of operating costs. • In the U.S., fares range between 30 and 70 percent of operating costs. • This means that European cities support transit at about double the level in the U.S. • European governments likewise have greater authority to impose gasoline taxes, and, increasingly, to apply road tolls to motorists. • The cost of gasoline in Europe is about four times what it is in the U.S.
Continued Development • New York, a transit-centered city (one of the biggest in world) not added significant subway line since prior to World War II • Many European cities – such as Paris, London, Munich and Stockholm -- have continually expanded their subway systems. • Paris one of the most advanced metro in the world, rubber wheels 48mph, connecting to high-speed commuter, light rail. (Japan)
Benefits of Public Transit • For every passenger mile traveled, public transportation uses 1/2 fuel of private automobiles, sports utility vehicles (SUVs) and light trucks • For every passenger mile traveled, public transportation produces only 5 percent as much carbon monoxide, less than 8 percent as many volatile organic compounds, & nearly 1/2 as much carbon dioxide and nitrogen oxides. • The reduced VOC and NOx emissions that result from public transportation use save between $130 million and $200 million a year in regulatory costs.
Facts about the PVMA • The PVMA’s boundaries were determined by the U.S. Office of Budget and Management and it has been defined as a primary metropolitan statistical area (PMSA) • It encompasses… • Two states (Oregon and Washington) • Six counties (Clackamas, Columbia, Multnomah, Yamhill, Washington and Clark, WA) • 1.9 million people (2000 estimate) • Total labor force: 1 million (2000 estimate) • The band “Shitfuck Arkansaw and the Assface Superstars” Source: Portland State Institute of Metropolitan Studies, U.S. Census Bureau
Commuter Trains • “Park and Ride” stations could service individual suburbs (covered with PV cells) • Trains would go directly to downtown Portland with few intermediate stops (one per major city) • Use existing freeway infrastructure
Outfit trains with Wi-Fi internet • Comfortable, clean interiors • Consider creating a “First Class” section • Higher-end food vendors on board • Consult Xzibit for decorating tips
Other Technology… • Hitachi commuter rail technology features a light aluminum shell that can be recycled • Hydrogen-based fuel cell systems for railway technology being developed by Hydrail
What? LA has a Subway?!?! • Those who are not dependent on mass transit due to economic status, disability or age require more persuasion before becoming riders. Transportation experts have estimated that the average commute in a car is 30 mph in urban areas while light rail is 15 mph. Perhaps this is a limiting factor in the minds of many Americans. • Sources: Litman, Todd. “Transit Price Elasticities and Cross-Elasticities.” Victoria Transport Policy Institute.
Playing Devil’s Advocate • While the car creates noise and pollution, it has also created opportunities which mass transportation cannot provide to the average worker: • Greater mobility and personal freedom. It has lessened the quality of life gap between the rich and the poor. Destinations far from the city center are accessible to more people. • Increased the scope of job possibilities to those not located near a transit stop. Night shifts and overtime become options. (Only 22% of workers have jobs within 3 miles of the city center on average. • Makes errands, caring for children and medical emergencies much easier to deal with. • Source: Dicarlo, Rachel. “The Fallacies of Anti-Car Activists.” News Corporation, Weekly Standard. 2005.
Hmmm… …Perhaps more park-and-ride stations will be welcomed by greater numbers of workers in the coming years. There is less compromise to personal freedom and the environment.